

A: In short words,
As long as stock makes higher tops and higher bottom, it is uptrend.
As long as stock makes lower tops and lower bottom, it is downtrend.
We can confirm it by drawing a trendline.
If you are day trader, then you can follow 5,10,15... minute time frame.
If you are a swing trader,then 30 min, 60 minute time frame is suitable.
If you are a short term investor, then go for daily time frame.
If you are a long term investor, then go for weekly time frame.
Time frame is a subjective aspect. Follow that time frame only which gives you maximum returns.
Good luck.
A: The whole point of charts is to help us predict likely outcomes so we can position ourselves accordingly. If kept simple, I believe technical analysis has something to offer. The problem is that a lot of technical 'analysts' (if that is what you call people who look at some patterns on a chart over a mug of tea in the morning) become prominent in the media (they give quick opinions to journalists and are always equivocal) without actually ever being asked whether they have a demonstrable track record or not. Trust me, if the likes of Mir/Hougaard/Linton...etc did have some kind of track record than you would hear about it very quickly. The sad truth is that a lot of technical analysis is generated by self-indulgent people who have a vested interest in trying to generate some quick trading ideas (and therefore commissions) from their CFD/spread betting clients. However, this doesn't mean that technical analysis is not a useful tool.
A: Technical Analysis has its place. By using it I find you can take some of the emotion out of trading, which can surely only be a good thing... What we seek from our investments/trades is that they go in the intended direction and make us money. So yes, sometimes we should be happy to give up some gain to stack the odds in our favour. The most likely outcome of the chart pattern below for instance is a break down but since we don't know what will happen the prudent thing is to wait and see.
 |
Take a look at the below chart...what happens? Pullback, up. Pullback, up. So what do we do? Traders wait for the pullback to finish and then we wade-in, investors partake of tea and toast and wait for the next leg up. Charts work because they tell you what the crowd has done and what they are likely to do in the future. Yes, news can change the lie of the land but all other things being equal, charts often allow us to predict what might happen in the future.
 |
The chart for Rank Group (below) currently doesn't look good. RNK, with it's higher lows and lower highs presents as a triangle and triangles are continuation patterns - that is to say that the most likely outcome is that that it will continue in the direction it started from, in this case down. Of course that may not happen, which is why buying a triangle before it breaks is just a low probability entry/trade. Low probablity because if we are wrong we will be stuck in a losing trade, probably with momentum behind the break.
...charts are not always right or helpful but they do tell you what the crowd has done and is doing (real-time)...either you see how that can help you in your trading/investing or you can't.
The starting point is chart patterns and then you need to learn how to combine charts with technical indicators. The best all round book on chart patterns is the lofty encyclopedia of chart patterns by Bulkowski. I'm not sure what book is best for indicators but most of it is freely available on the internet.
I'll end the discussion by saying this - any NRK investor who had glanced at a chart every day would not have lost all their money. End of. The price gapped down, cutting through the trendline. The arrow marks the spot that the prudent end-of-day chart watcher could have saved themselves a lot of pain.
 |
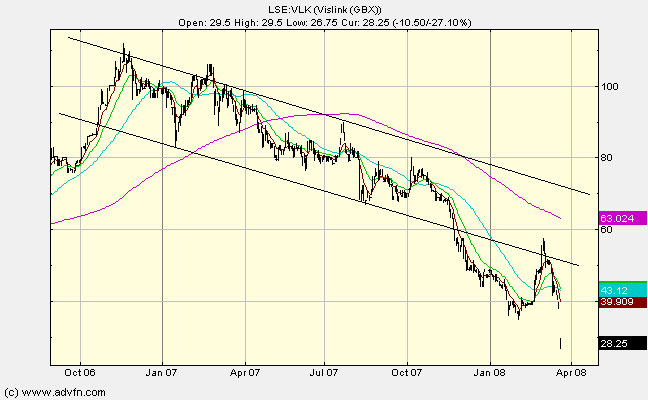
A: I agree. Charts do not predict the future but please look at the TAN, VLK, MPH, VAN, MDX charts, to name but a few, and see whether you can see how holders could have saved themselves huge losses.
Below is the snapshot chart of Vislink Share Price (VLK). Can you see the merit in getting out when the price crosses the lower trendline?
The thing about charts and indicators is that you don't need to believe in them, you just need to understand that a lot of people do believe in them and that there is an inevitability that some things will happen, if only briefly.
 |
So, just by way of an example: when I observe that two of the faster moving averages cross the price can go some distance in the direction of the cross. The reason that happens is that everyone in the city is taught that a bullish occurrence is the crossing of the 20 moving average over the 50 moving average (it's called a golden cross).
Therefore, something happens when those moving average cross. Whether there is any significance to the move is neither here nor there - the fact is that if everyone expects something to happen then it will. Nothing random about it.
Trendlines are logical. If a price tests a level several times and doesn't go higher or lower (depending on direction), buyers or sellers take a view that it's not going any further in that direction and buy or sell depending on their view. Thus you see a price 'bouncing off' a trendline - all that's going on is that holders see the trendline approaching and have been told to sell if it crosses below it. Shorters are poised to short the breach and buyers have been told to buy if it bounces. What actually happens depends on who does what but everyone knows something is going to happen when you get to a trendline and that's the point.
Disclaimer: This example is purely quoted for educational purposes only and is not a recommendation to buy or sell Vislink Security!
A: I don't think one has to be very bright to trade, I know that 100% because I am not particularly bright. What I mean by bright in this context is that I'm not technically minded. What one has to have though' is a way of sifting through the strategy/techniques to find something that works. That's not easy as it all works some of the time! My strategy has always been to find the people making money and find out what they are doing and then see if I can do same. Some things just don't work for me and others do. I'll talk more about it later perhaps.
A nice book on technical analysis would be "Technical Analysis for Dummies" by Barbara Rockefeller - available from Amazon. It is one of the better books I have read on charts and technical analysis for its simplicity and clarity.
The Chartist's Prayer -> May my assessment of today's market be based upon the facts, all of the facts and nothing but the facts. May I not be influenced by fear, greed or the ill-advised comments of others, which may be made in their interest and not mine.
May I take into account the past history laid before me on this chart and may my assessment be based on facts and my knowledge and please, if possible, never on my emotions.
A: Response from Henry, an experienced technical analyst. I wouldn't bother with books on trading the bars. I use just the very basics and it works fine. John Murphy's guide to candle patterns on Barcharts.com covers everything. All I use are the trend reversal patterns. The problem for most of us is that a trend is the easiest thing in the world to follow but consolidations and range trading are what bugger us up. I have devised a simple method to overcome this. I have taken a difficult section of the recent past FTSE chart where it moves from uptrend into consolidation. It then sets up a trap to the bear side and reverses back up into an uptrend.
A trend starts with a candle crossing a moving average line but the bar must be CLEAR of the moving average line - no touching or chopping. The trend closes when the whole body of the candle crosses back over the m/a line the candle must be a down candle below the line or an up candle above the line. An up candle crossing the m/a does not close the trade. For the next trend to start the candle must break a previous high or low. This prevents whipsaws in consolidations. The price break must come with a candle that is clear of the m/a line.
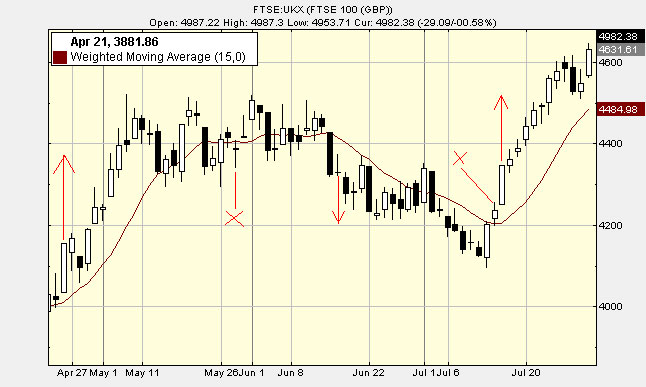 |
Avoiding consolidations is just as important as finding the start of a trend. In the chart example the initial trend closes at 'X'. The bars then cross down through the m/a. Had they continued with a clear bar they would have started a new down trend but they didn't. Instead they chopped back up above the m/a. This confirms we are in consolidation. At this point all trading stops until the is a price breakout of previous high/low with a clear bar. As always nothing works all the time but this will stack the odds firmly in your favour. I then combine the above with support and resistance targets and an indicator. Hope I have explained clear enough.
This approach works on all timeframes. For intraday it works best at times of maximum volatility so 08:00 - 09:00 and 14:30 - 16:30. I also look for slow trend patterns with pullbacks and bounces off of 20m/a or faster trend patterns with higher highs and higher lows. These types of pattern are best left for the less volatile times. As far as indicators go use a trend indicator such as CCI or MACD in volatile times and stochastic SMI in slower trends or sideways markets.
The content of this site is copyright 2016 Financial Spread Betting Ltd. Please contact us if you wish to reproduce any of it.