Three Key Principles for Profitable Fixed Odds Trading
In our opinion the three key principles of fixed odds trading are:
- Understanding Trends
- Understanding Volatility
- Understanding Fundamental news
Understanding Trends
There are many ways of examining the strength of the trend. There's no need to get overly complex about this, sometimes a simple eye balling of a chart will tell you all you need. Here are a few useful additions:
- Moving Average - The 50 and 20 Exponential moving average can tell you a lot in our opinion.
- Strength of pullbacks - If pull backs are weak and recoveries strong the market is telling you it wants to go up! Have a look at how shallow the pullbacks have been throughout this rally on the Dow (see chart above).
- Across markets - Keep your eye on different indices. The Dow might tell you something the S&P isn't.
- Multiple Time frames - View the trend from a broader perspective. A weekly/ monthly chart can show you just how strong or weak this trend really is:
Understanding Volatility
With fixed odds trading we can make money in trending and non trading markets as long as we anticipate the levels that will or won't be touched. Understanding the trend only goes so far because it doesn't tell us how soon we are likely to reach our destination point. When markets are volatile they will move quicker in one direction for a short period, when volatility is low we may get little movement or very slow movement. Markets cycle continuously through bursts of intense activity, followed by periods of relative calm. Understanding volatility can help us determine our time frames, it helps us predict possible break out points but not the direction. Useful ways of tracking volatility:
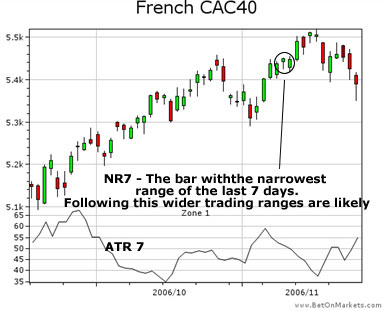
- Narrow Range Bars (NR7): The day's "range" refers to the difference between the day's high and the day's low. Identifying the day with the narrowest range of the last 7 days can give you clues as to when the market is likely to experience an upswing in volatility. Be wary of placing "No Touch" trades on these days as significant movement may follow. Conversely they can be good days to place "One Touch" trades.
- Bollinger Bands: Bollinger Bands can be a useful predictor of impending market movement. When they are tightening look for a break out, when they are expanding look for consolidation.
- VIX: The VIX is a measure of implied volatility in the options market. Extreme readings of the VIX can represent fear or complacency depending on the market cycle. Right now the VIX is very low, indicating market traders are overly complacent (i.e. a correct downwards could be due). Indeed the VIX dipped below 11 last Friday and we all know what happened subsequently on Monday.
Understanding Fundamental news
It seems like every day between 8.30am and 12pm EST. we are bombarded with economic data. With so many numbers thrown at you, at what point do you start ripping your hair out and wondering if there an easier solution, one that will point you to only the important economic numbers, and allow you to buffer out the not so important numbers.
Well here is the list of the whos who of the world of economic data for US.
- FOMC meetings. This of course is the most influential one. Markets can move drastically after the 2.15pm release of the decision to raise rates or not. Also in that same breath keep an eye on when the minutes of the meeting are made public, it has almost the same affect, because it allows the public to digest exactly what the governors are thinking when they made that decision, and how close was the vote.
- Non Farm Payroll. If ever there was an event that can send both the currency and the index market into a frenzy this is it. Most FX trading companies move away from fixed pip between the ask/bid during this time because the market moves so violently. I have seen people lose $125,000 in a matter of seconds. It is my suggestion to never have an exposed position during this event.
- Interest sensitive reports. Ok there are a few here, but over time you will be able to see which ones are more important then others.
a. CPI
b. PPI
c. ISM
d. Leading indicators
I know thats a lot but eventually you will be able to see how connected they are, basically they show how inflation is translating into our everyday spending. The FOMC has a 2-3% target for inflation, go over that, and there is a rate hike coming to slow down the economy back into its target rate. And we all know how much the currency market and the Stock Market love those.
If you ever wondered why the market falls when the interest rates are raised? Here is the basic 411. When rates increase, it costs more money to finance projects. This means profitable projects have their margins narrowed or become unprofitable because lending costs increase. Now thats at one company, imagine that happening across every industry. The most affected are the insurance/banks. All of a sudden they have to pay more for their overnight borrowings.