Trading Strategies and Binary
Placing your bets at random will probably not get you very far, what you actually need is a basis on which to form a few trading strategies. Here we will cover some simple ideas which could be backtested and improved to form some trading setups.
Binary.com provides charting facilites on the site. Although they aren't the most sophisticated charts you will find, it is easy to plot a 6-month chart with a moving average on. Take a look and have a play around with it.
Charting
http://www.Binary.com:
- Click on the link above and then Charting and then Charts.
- Click on Indices.
- Choose the Dow Jones Index
- Change the period to 6 months
- Change Bar Chart to Line
- Change the Indicator to Moving Average
- Change the Number of Days to 100
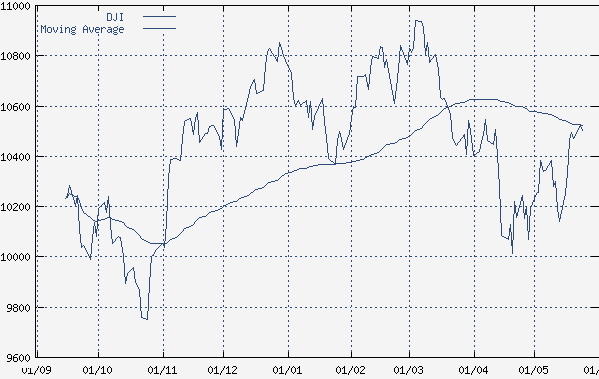
You will be given a chart similar to one above. Here you can see the movement of the Dow Jones Index relative to the 100 day Simple Moving Average (SMA).
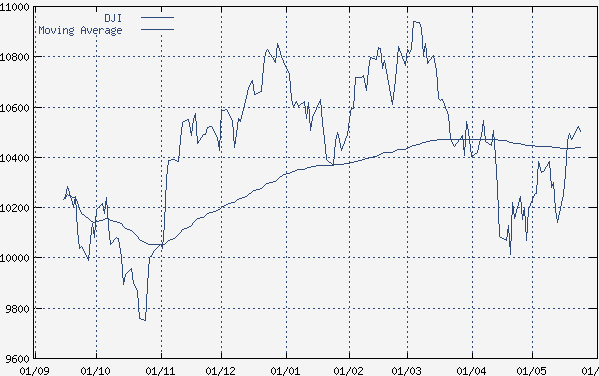
Repeat this procedure but this time use the 250 day moving average.
As you can see above, the price of the Dow Jones crossed below the 100 day SMA at 10600. At the same time, the 250 day SMA was at roughly 10480.
Trading Strategy?
From when the price crossed below the 100 day SMA in the middle of March, it took less than 1 month to cross below the 250 day SMA and then continue downwards. Coincidence?
When a price moves below a moving average, the chances are that it is following the path of least resistance. If you look further along the chart, the price moves above the 250 day SMA at around 10440 in the middle of May. It then continues upwards to touch the 100 day SMA at around 10520 within a few days.
So how could you use this?
Perhaps a "One Touch" bet. When the price moves above or below a major SMA, look where the next major SMA is. It may well be worth buying a "One Touch" bet just above or below the next major SMA.
In the case of this example, when the price moved below the 100 day SMA (10600), a reasonable expectation is that it will continue to fall and perhaps move below the next. In order to "back" this assumption, you could buy a "One Touch" or a "Bear" bet that the market will continue to fall.
When the market is at 10600, the 250 day SMA is at 10450-10480. If you wanted to back it to fall further you would buy a bet such as "I wish to win GBP50 if at any time within the next 30 days the Dow Jones Index trades at or through 10450".
You buy this bet and then if the market trades at 10450 for even a second before the middle of April, your bet expires and you win. Simple? Yes. Guaranteed? No.
However, you total risk is the price of the premium. Unlike spread-betting, the worst that can happen is that you lose the bet. No need for stop losses etc. You can simply buy the bet and then wait.
Binary.com allows you to plot 10 different SMAs. These could be used on a shorter or longer scale to try and setup trades like the example above.
Some suggestions could be:
- 20/50
- 50/100
- 100/250
- 250/500
- Change the period to 6 months
- Change Bar Chart to Line
- Change the Indicator to Moving Average
- Change the Number of Days to 100
and so on... The last pairing would involve a long term strategy but if you want to back-test this I would suggest looking at the charts as above.
Brought to you in association with FinancialSpreadTrading.co.uk
Please do not copy/paste this content without permission. If you want to use any of it on your website contact us via email at  traderATfinancial-spread-betting.com (remove the AT and substitute by @).