Is the Next Bear Market in US Equities just around the Corner?
May 29, 2013 at 11:52 am in Fundamental Analysis by Dave
Positive market sentiment has certainly been rising continuously over the last few months – certainly amongst US investors and in particular institutional ones. The financial crisis, the 2000 tech bubble, the MBS collapse – all have seemingly been consigned to the nether regions of investors’ memories.
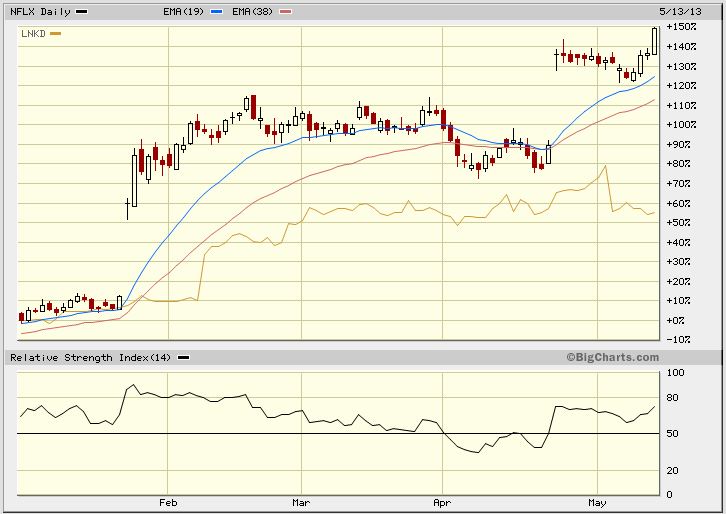
The trade du jour for many investors is to remain with the momentum and buy every dip, no matter how small. The old adage “the trend is your friend” is the mantra, forgetting the 2nd part of this saying “until it ends”… There have been some stunning moves in recent months in the more speculative arena of the market with the likes of heavily indebted (off balance sheet) Netflix rising from just under $50 back towards $230. Ditto with Linkedin and many other tech names. Valuations no longer matters, it seems, and there is blind faith in the U.S. Federal Reserve and the so called “Bernanke Put” — a belief that “Helicopter Ben” has eliminated any downside risks in equity markets and that the current extensive and sustained monetary easing program is the infallible recipe that keeps the engine of the market oiled only to the upside. Mmmm…
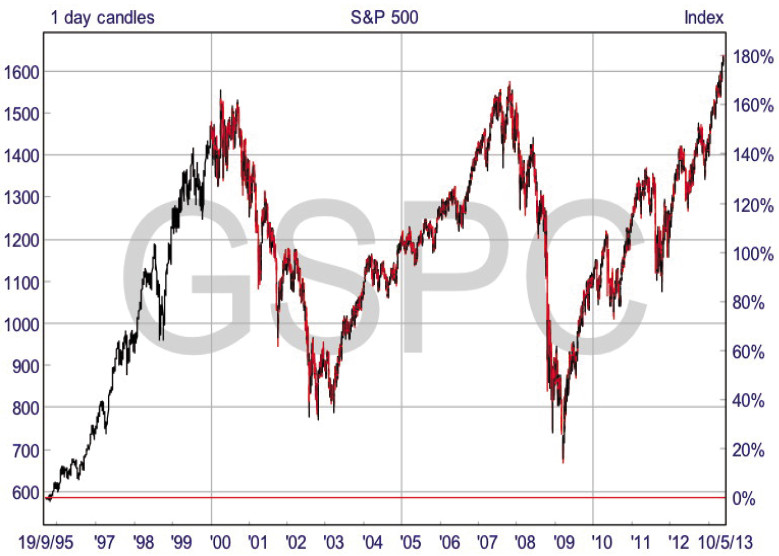
A particularly worrying sign to us is that after the material bear market of 2008-09 in which US retail investors ran for the exit and continued to be net sellers right up until the early part of this year – 4 whole years of selling – it is only now, with the S&P 500 up almost 140% from the lows, that they are turning bullish again. This to us is madness – the game is to buy low, be patient and sell high, not follow lemming-like into equities at a valuation high in the hope of missing out on further gains. Those readers with longer memories will recall this script from 1999/2000, and we all recall how that ended…
There are increasing signs that professional investors in the US are now selling into this strength and, coupled with the dearth of corporate deals, certainly for cash, this is surprising given the heavily padded balance sheets of corporate US. This also tells us that executive management en bloc does not see value in the market at large. The much anticipated deal boom for 2013 has not even got started.
 There is also no doubt that the U.S. economy itself is recovering, and indeed has been for the past 4 years in unison with the bull market and unlike the stop-start situations in the UK & Europe. Data coming out of the USA labour market gives us reasons to believe the worst is behind us with regards to economic aftershocks from the GFC, although the same most certainly cannot be said for Europe.
Of course the stock market is a discounting mechanism – generally between 6-9 months – and it is entirely understandable that equity markets have risen in advance of the real economy catching up. The question now however is have the markets gone too far and is the belief in the Bernanke Put warranted given that the first noises about the QE exit plan are now being made.
While the S&P 500 is now trading at the time of writing at 1,633, unemployment is still near 7.5% – an historically quite high level and the Fed is targeting just over 6% as a point to really unwind their balance sheet. Bulls take solace in this as a reason for the market to continue higher – reasoning that it will take some time before this level is hit and the liquidity spigots are turned off. The unemployment number is however a distortion of the cruel reality faced by many people in the US as it is more the result of a narrowing workforce and economic inactivity than of a growing number of jobs being created.
One thing to reflect on too: if the market continues to rise at the current pace, when the unemployment rate hits 5% we will have the S&P 500 trading at around 4,000!
With the bull market now in its 4th year and getting long in the tooth, it’s time to take a look at some objective facts:
- On 9 March, 2009 the S&P 500 closed at its worst level during the crisis, hitting a floor of the Devil’s number itself — 666. Since then it has risen in 35 out of 51 months and currently registers a gain of 141% – one of the largest bull market gains on record.
- On 3 October, 2011 the market hit a mid bull market cyclical bottom after a few months of successive declines. On that day the S&P 500 closed at 1,099.2 and it has now managed to recover 49% during the course of just 20 months. It rose in 16 out of those 20 months.
- The current month is the 7th consecutive rising month.
- During the last 12 months, the S&P has declined in just one month – it was last October and by a pretty small 2%.
- Currently the S&P 500 is 14.5% higher YTD and up 20.3% over the 12 months period.
These statistics should certainly cause caution to be exercised for bulls of the market and one could be forgiven for concluding that a decent correction is now long overdue. Question is what would be the catalyst?
Compared with history, the current bull run is one of the strongest and most persistent in history. Even rivalling the increases seen into the 1929 and 1937 highs, and yet the real economy has not performed anywhere near as well as the rebounds seen back then. The explanation for this unusual strength? Two letters: QE. When QE ends so goes the bull market and the recent declines in gold are, in our opinion, the “canary in the coal mine”. Take a look at the chart below to see just how tight the correlation has been between the S&P 500 and the size of the Fed’s balance sheet. The R squared is almost 100%.
 Throw into the mix the present valuation on the US market and the warning signs look ready to switch from amber to red to us. With corporate margins near all-time highs and the unemployment rate falling, there could be pressure on margins from the costs side. Additionally, many of the cost savings of the last 4 years are likely now exhausted and so high PE multiples against potentially compressing margins and profitability seem at odds with each other.
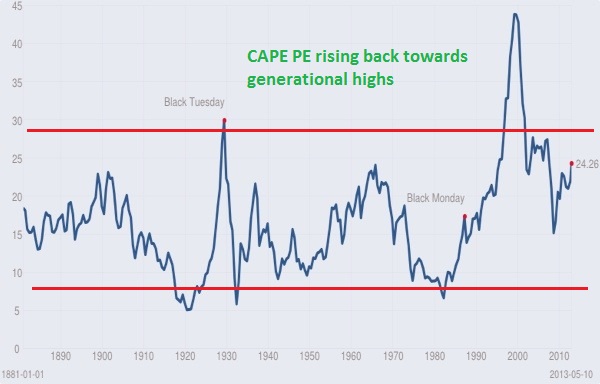
One of the most useful ratios to use in order to assess the markets under or overvaluation is the P/E CAPE ratio, or Schiller’s ratio. It is a price to earnings ratio adjusted for inflation and one that is a smoothed measure. The average for this ratio over a hundred years is 16.47 and it is currently showing a reading of 24.26. It has been rising substantially over the last few months and is now approaching its pre-financial crisis levels. Of course, QE has distorted this, but remember that if QE ends and the so called “Bernanke Put” proves to be no more, then should the market take a sharp tumble in anticipating this, those recent retail buyers will most likely act according to norm and run for the exit once again. This is how bear markets begin…
 Both rising interest rates and inflation pose a serious threat to the market. If inflation finally rises as the banks’ repaired balance sheets gives them the room to begin lending en masse again (and there are early signs of this), then the money multiplier effect which has been absent during the QE programs in the wider economy will likely finally kick in. End result: rising inflation. Rising inflation = rising interest rates and so a brake on equity valuations.
At the time of writing, one of the WSJ’s columnists Jon Hilsenrath, widely seen as the media mouthpiece of the FED, has been tentatively making remarks on their behalf about the FED’s exit from the QE programs. Initially he has said that the amount invested each month in bonds will be tapered and this has, at the time of writing, been largely shrugged off by the markets. Once this becomes a reality, we doubt it will be accepted in such a muted manner by the equity markets though.
And so, if QE is the primary explanation for the outsized bull market gains, then it is logical to assume that upon its withdrawal, even in part, that one of the fundamental pillars to this bull market will be pulled away. One thing is for sure, the stock market is now arguably out of sync with the real economy and is once more overvalued. Adding to long positions here is becoming an ever increasingly risky business.
Article reproduced from the June 2013 edition of Spread Betting eMagazine