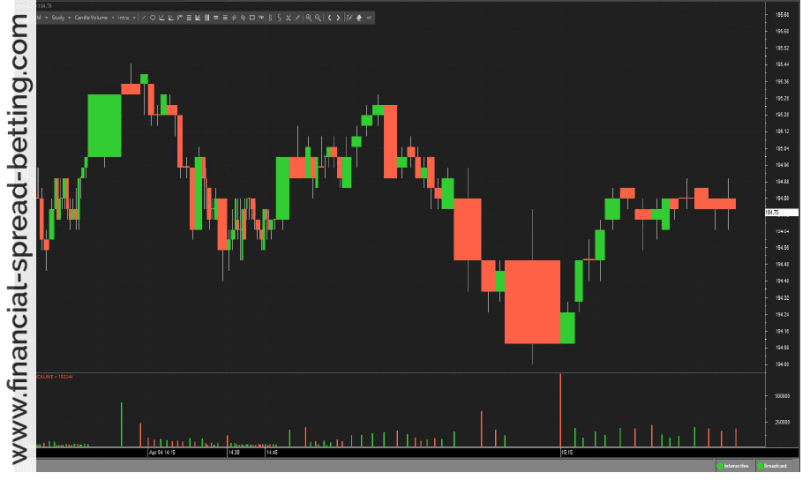
You know how I’m always saying that you have to take account of volume when considering what the market is telling you? Well here’s a clever idea that someone came up with so that you will find it impossible to ignore volume when you look at the charts. The volume is incorporated into each individual candlestick by making the width of the body proportional to it – so a ‘fat’ candle shows a lot of trading volume, and a ‘thin’ candle shows little trading interest. Here’s the chart with that applied –
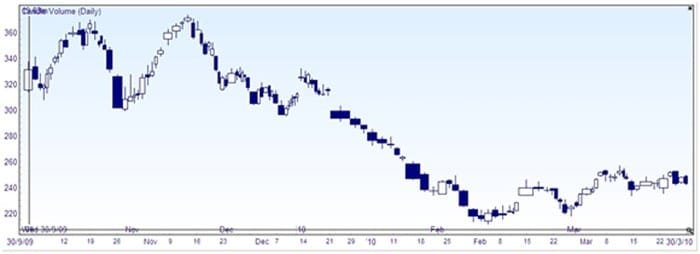
The general rule is that in a bullish market volume and price usually increase; a bearish market often has both volume and price reducing. If a bullish move was not supported by volume, then it would be suspect. But the interesting thing to me in the above chart is the high volume bearish candles, which stand out more than any bullish candles. These are putting a determined stamp on their downtrends, and are significant. This fact becomes obvious when you look at a candle volume chart, but might be missed on a regular candlestick chart.
You can also see that the bullish correction which came in December was very weak. You would look for and expect fatter candles when the price was rising and they don’t appear here, so the resumption of the downtrend was almost inevitable. Just as a candlestick chart makes the price action much easier to follow than a bar chart, so a candle volume chart makes the volume action much easier to follow.
So if a candle volume chart is so much clearer than the regular candle chart, why isn’t it used more? Possibly it’s because, as a result of the method of drawing, the timescale varies. It has to, to accommodate the fatter candles where they occur, and close up the time if there is little volume to be seen. This changing scale means that other analysis, such as drawing straight trend lines, cannot be done in the regular way. What you get with candle volume charts is obvious volume information, but other factors can be affected.