How to Design a Trading Strategy
Before we start:
All Traders should have a mantra, as follows:
- I will educate myself on how the market works
- I will learn how to find and place a trade
- I will create a trading plan and trade my plan
- I will not chase the market with emotions
- I will decide to be a day trader or an overnight trader (or longer) before I enter the market to help to control my emotions
- I will be patient and wait for a market set up
- I will never trade without a protective stop loss order
- The market will meet my criteria or I will not trade
I have refined a standard procedure that I use for the process of creating a trading strategy. I always start with the big picture and make increasingly more detailed decisions about the strategy.
I begin with the assessment of what type market action I want to trade and what kind of trader I am. Then I end up with making decisions on exits, and how far away to put my money management stops.
How can you adapt my strategy making to your personal psychology?
You Must Pick the Market
The first decision you must make is what type of market you want to trade. Although this may look like an easy decision, in fact, it is a difficult judgment, because most new traders only consider the profit aspect. They simply try to pick the strategy that they think will make the most money. Focusing on money will probably lead you to make the wrong decision. It is the psychological aspect of trading each of the markets that is the most important consideration. It does not make sense to create a very profitable strategy if you are unable to trade psychologically.
What is Your Trading Time Frame?
You need to decide whether you will day trade or trade on daily or weekly charts. It is very difficult to have a job and trade intra-day. It is not totally impossible, just very difficult.
Most people want to trade part time and still hold down a day job. If you want to do this, it is better to trade daily or weekly charts. You will only be able to look at the market outside of your working hours and your strategy design will have to take this into account.
The strategy should not require you to check the market during the day. I think that there is only a certain amount of money that you can get from the markets and that depends on the time frame you choose to trade.
Time frame choice is a personal decision, and of course there are no right or wrong answers. The ultimate decision is personal preference influenced by financial your considerations. But you have to make this decision before you start looking for indicators, as the choice of indicators is influenced by the time frame selection.
However remember the old saying: “if you ‘buy and hold’ then eventually everything will be fine. Remember the expression touted – “It’s time in the market, not timing the market.”
You know what, for shares the “time in the market” argument is starting to look pretty thin at the moment. Take a look at Australian All Ords chart below:
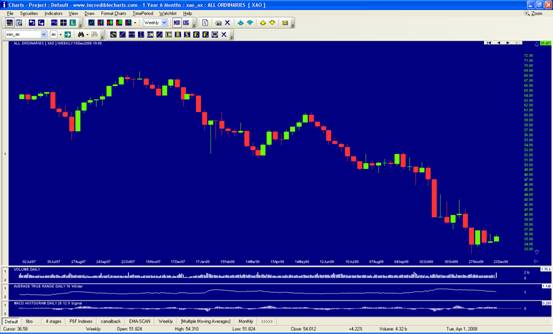
This is a weekly chart from June 2007 to December 2008. This, in my opinion, makes the “time in the market” argument look pretty weak.
My guess is that more active investment management will be the key for anyone wanting to make a better-than-inflation return from shares over the next five years.
What I am trying to point out is that short term or day trading in this type of market is better than buy and hold. But it must fit in with your time availability.
The Types of Market
There are three types of market action: trending, directionless and volatile. I think a directionless market is very hard to trade, thus I will not discuss the directionless market here. I would suggest trading either a trending market or a volatility market.
You can choose a trend strategy, knowing that you are going to have to trade through periods of corrections during the directionless phase, or you choose a volatility strategy that will give you extended periods of doing nothing while you wait for the next trade. Which one is for you?
We will look at a volatile market and a trending market and build our strategy accordingly.
What is a Volatile Market?
A volatile market is characterized by sharp jumps in price, up or down. This type of market action involves a quick and unexpected change in volatility. One measure of volatility might be the difference or spread between two moving averages – the spread increases with volatility. Price action, such as gap openings or an increase in the daily range, can also be considered an indication of an increase in volatility.
Each of these two types of markets (Trending and Volatile) are tradable, but with markedly different trading strategies. Let’s take a look at each type of market behaviour and the strategies that are appropriate to that type of market.
Strategy: Volatile market
Trades generated by this type of strategy are usually short-term, and when trading this type of strategy, you will be out of the market a significant amount of time.
Volatility strategies generate a high percentage of winning trades, although these trades usually generate small profits per trade. The Foreign Exchange (Forex) market is a typical market that I would class as volatile. Trend following strategies don’t work well in the Forex market.
Today’s market volatility is unprecedented, but so is the market opportunity if you have the right trading methodology. With CFD Trading you don’t have to worry about whether the market goes up, down or sideways as long as it stays within your boundaries. The record volatility has created great value for CFD or day trades, while allowing you to set conservative strike prices.
Whether you are a novice or experienced day trader, you now have the opportunity to learn how to take advantage of today’s chaotic market conditions and target attractive profits.
However you must realise that trading a volatile market, e.g. day trading, is inhabited by the sharpest minds in the game. They are all out to grab your money. The best way to start day trading is slowly, calmly and armed with all the education and the best mentorship you can muster. Look at your market indicators and learn how they interact.
Comparing medium or long term trading with day trading is like comparing a wombat with a kangaroo. Entry points, exit points and risk reward ratios are different. Go slowly when you begin day trading. Preserve your trading capital and most of all, don’t trade without a trading plan.
Let us have a look at some indicators I use.
I use volume, 3 moving averages (MA), MACD and stochastic indicator.
Generally, I use a 5 minute chart with the MA set at 18, 39 at 50 periods. The MA18 and 39 are my main ones, while I keep the 50 as my trend indicator. I have also volume, MACD and stochastic on the chart.
When trading CFD, I set my daily range as per my Bias Indicator, as outlined on my CFD web site. Then I look for possible trades on a number of charts in my watch list. I look for trends and volatility.
If the trend is going up, I watch for an opportunity to go long, if the trend is going down, I seek to go short. Always wait for a retracement, watch the MACD and stochastic indicators. In this discussion, I will concentrate on going long, however you can apply the opposite technique to go short.
Let us assume that we have an uptrend and the last few candles show a retracement. Watch your stochastic indicator. If it shows oversold, wait for it to turn up. Also watch your MACD. It should also start to turn up. If possible, candles should show a clear swing low.
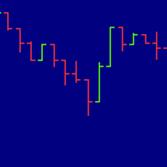
A swing low requires at least three periods (bars on a bar chart) to be established. A swing low is formed when a period’s low is lower than both the period before it and the period after it. A swing high is the reverse. It is formed when a period’s high is higher than both the period before and after it. You cannot say that a particular bar on a chart is the lowest the stock will go until the stock experiences a period in which it does not continue to go lower. Therefore, in its simplest definition a swing low is not established until a period occurs in which a stock does not make a new low for the move.
This should establish your entry point to go long.
Exits are somewhat more intuitive, especially once you are in profit. I generally exit when I get a swing high, when the MACD starts to turn down or when the stochastic indicator starts to turn down. I am happy to exit with small profits rather than let them turn into a loss.
Day trading is part mechanical and part intuitive. You have to watch all the time, adjust your trailing stop loss and take profits when you can.
I believe it is one of the toughest ways of trading, but in a volatile market, can also be one of the most profitable.
Now let us explore how to set a strategy for a trending market
Should we use weekly or daily charts?
Weekly charts are much more difficult to trade because it takes more discipline. To trade weekly charts, you must make your decisions on the weekends and not make any changes until the next weekend. For most traders, this is very difficult to do. It is very easy to yield to temptation and move a stop loss or a money management stop, or want to keep your profits and exit the market early.
Most people don’t think of trading weekly charts. My experience is that when following trend trading, there is a lot of money to be made trading weekly charts, simply because so few traders are able to do so. To make money in the markets, you have to walk where the average traders do not venture. Weekly charts are one of those places. However, whether you us weekly or daily charts, the strategy remains very similar. There is more price detail in the daily chart, but also more price noise.
What is a Set-Up for a Trade?
Let us look at some of the indicators which we could use. For a trending market, trading for the medium or longer term, I prefer to use Exponential Moving Averages (EMA) of 150, 50 and 20 periods. I would like to point out that I rarely enter a trade long if the price is below the 150 day EMA.
The other guide I use is volume. Volume indicates interest by other traders and momentum in the market.
I am sure that most traders have tested the Moving Average Crossover Strategy sometime in their trading career. The average trader will look at this strategy and believe that the only thing to test is if the two or more moving averages cross over.
New traders will experiment with many different lengths for the averages. As I said before, I prefer to use Exponential Moving Averages (EMA) of 150, 50 and 20 periods.
When they don’t find any that work to their satisfaction, they discard the moving average strategy concept entirely and move on to something else. They keep looking for that Holy Grail indicator that they hope can instantly make them successful.
We have all been there and have all discarded many great ideas. The discarding of an idea, more often than not, is a mistake. I believe that for the most part, any indicator can be made into a profitable strategy. Yes, I said any indicator. When we discard the moving averages, it is usually a mistake because the moving averages by themselves only represent one half of the strategy development process.
The second half of a strategy, the half that most traders ignore completely, is what I call the “Entry Point.” I will talk about exactly what these two terms mean and how using them. Together they can turn something as simple as a moving average crossover into a promising new trading technique.
To develop and execute a successful strategy, we need a set-up and an entry signal. The set-up is the set of conditions that are necessary prior to considering taking a position in the market. It consists of the indicator or group of indicators that tell us to get readyto enter the fray. Set-ups don’t get you in the market; they simply make you aware that a trade could be possible.
Here are some examples of a trend following set-up:
- A fast moving EMA crossing over a slow moving EMA
- Price moving close to or outside a channel, e.g. Bollinger or Standard deviation channel
- Prices reaching the upper or lower line of a moving average envelope
- Sudden increase in volume
There are countless other indicators and conditions that could be used as set-ups. In the final analysis, you are limited only by your creativity.
Once we have defined our set-up rules, we can then establish our Entry rules.
Creating Entry Rules
By trading only set-ups, you lose the added accuracy and increased profitability of a strategy that uses both set-up and entry. If trading set-ups by themselves worked and was profitable, trading would be easy and all traders would be rich.
An entry is the signal by which the trader purchases the contract in the market. It is the technique that a trader should use to take a market position once the rules for the setup have been met.
Entry selection is dependent on the type of set-up you’ve designed. The entries must be designed differently depending on the type of strategy you choose to trade.
There are two rules which should be followed to enter a trade.
The first rule requires prices to move in the expected direction before entering the market. If our set-up indicates a long position, we would require the price action to move up in some specified manner before we would be comfortable taking a position. We want the price action to confirm the set-up and force us into taking a position.
For instance, let us assume that on today’s close our set-up has given us a long signal. We might require a breakout above the high of today’s bar to confirm that the market is in bullish mode. With this breakout as a condition of entry, we have now required specific market action in the direction of the set-up before we risk taking a market position.
You may decide to place a buy order if the price is a set number of points above the previous day’s close. It is up to you to decide what your entry point should be, once you have a set up.
The only limit to creating viable entries is your creativity. There are potentially many techniques that make interesting entries.
The second rule requires you to enter the trade if your entry point is met. You should not hesitate to enter.
Trading the set-up and entry concept and making sure that you follow the rules gives far superior results when compared to trading either set-ups or entries by themselves. Using both a set-up and an entry together enhances the performance and profitability of a strategy.
I wish you success with your trading.
Join the discussion