
Moving Averages
A moving average is a line drawn on a stock chart representing the average price of a stock over a given period. They smooth out the gyrations in the stock price so that the trend becomes more obvious
The most common types of moving averages are the SMA (Simple Moving Average) and the EMA (Exponential Moving Average)
The SMA takes a stock’s prices over a given period and averages those prices. A line is then drawn to represent the average price over time. Simple Moving Averages are slow to react to recent price changes
An Exponential Moving Average is calculated in a similar manner to the SMA except that the EMA places more weight on recent prices. This means that they react more quickly than SMAs to recent price action
Some traders like SMAs, others prefer EMAs. I only use EMAs. I find that SMAs aren’t a good fit for the types of stock chart analysis that I perform. In my opinion, EMAs respond better
Two important things to realize about moving averages, no matter what type you are considering…
- they are lagging indicators. They show you where the price has been. They don’t predict future price movements.
- they only work in trending markets where there is a clear and distinct trend. They don’t work in ranging markets where the price is bouncing up and down between support and resistance levels.
Note: regarding “trending” and “ranging” stocks. Some traders use an indicator called ADX (Average Directional Index) to determine if a stock is “trending” or “ranging”.
Exponential Moving Average
The exponential moving average and the weighted moving average try to overcome some of the perceived shortcomings of the simple moving average by applying more weight to recent prices. The weighted moving average requires each price in the series to be multiplied according to how recent it is, so for instance a 10 day weighted moving average would have the most recent price multiplied by 10, then added to the next most recent multiplied by nine, then the next multiplied by eight and so on, until you get to the 10th most recent price which is simply added as it is. Of course, you have to divide this sum of prices by the appropriate number to get back to a number comparable to the price, and in the case of a 10 day weighted average the dividing number would be 55. The general divisor is N*(N+1)/2 where N is the number of terms, as I’m sure the mathematicians are pointing out.
Fortunately, computers are prolific and easily able to perform this calculation for you, as well as the calculation for exponential moving averages which is more complex and repetitive. Similarly to the weighted moving average, the exponential moving average applies more weight to recent prices, but in a way that uses historic data. I’ve added a 10 day exponential moving average EMA(10) in green to the previous chart, and just show part of it here enlarged so that the difference is clearer –
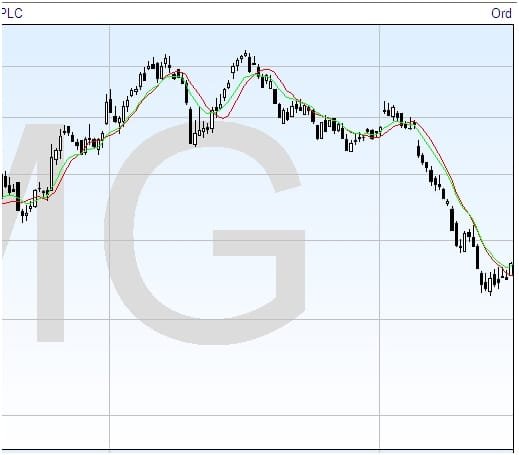
As you would expect, with the recent information being made more important by the method of calculation, the EMA follows the price a little more closely, and this is most noticeable at changes in direction. Note that you could make the simple moving average or SMA follow the price more closely simply by using a smaller number of days, but this would not have the same effect as using the EMA.