Module 5 – Volume and Open Interest
Introduction
As I said in the first module, there are two or three factors that are the basis of technical analysis. These are price, volume and – for futures and options – open interest. Our discussions so far have been about price movements, although we have acknowledged the importance of volume in confirming or denying what prices seem to be telling us. Price is certainly the most important. Volume and, to a lesser extent, open interest are used primarily to confirm what the price is indicating.
In this module, we’ll take a closer look at volume and open interest, and how they can enter the forecasting process. I’ll also cover a couple of individual charting features, called reversal days and gaps, to complete the explanation of how they give us more information and pointers for our trading.
Volume
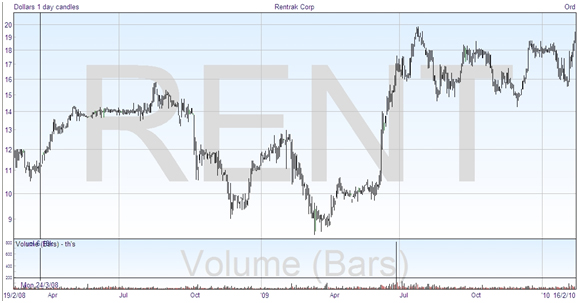
The volume is the number of shares or contracts traded. Each day, or whatever time scale is being looked at, the volume is represented by a vertical bar below the price chart, so that a typical chart will look like this –
Volume can also be plotted on weekly charts, and shows the total volume traded for the week. Usually we don’t bother to show volume on monthly charts, as it is not very useful over that timescale.
As a general rule, if you are looking at an uptrend and volume is increasing, then the market is considered strong. If the volume is going down in an uptrend it shows the market is weak. Even for a downtrend, the strength of the move depends on the volume – more volume means that more market participants are joining in, and suggests a continuation of the trend.
Volume is the secret to knowing how much urgency there is to a market price move. If there is much volume or pressure, then it helps you to see that the move is well supported and strong, and have more confidence trading on it. Volume should always increase in the direction of the existing trend, so in an uptrend the volume gets more as the price increases, and declines on retracements – if you see anything else, it is a warning sign. If you were to see a new high formed but the volume was reducing, or if the volume increased on corrections, it would suggest trouble ahead, and the trend might be in danger.
With that said, you would normally expect to see higher volume when the price is increasing than when it is going down. Price can go down easily without much trading pressure. It’s like trying to fill a bathtub that has a leaking plug – you need a good flow or volume to push the level up, but going down happens almost on its own.
As a reminder of what we covered in the previous module on patterns, the volume has an important part to play in confirming validity of the pattern. Remember that in identifying the head and shoulders pattern, the volume got less on each successive peak, and picked up during the declines. A similar thing happens on triple tops and double tops. Whenever there is a resolution of the pattern, which in these cases is a breakout to reverse the trend, you should expect to see much heavier volume. If the breakout retraces, it should do so with light volume and find resistance at the previous support.
If you think about it, looking at both price and volume gives us two different views of the same thing that is the buying or selling pressure on the security. The volume shows us directly the pressure which has been resolved in sales, and the price reflects the amount of supply and demand pressure, whether or not it has had much trading. Technicians often say that volume precedes price, which means that when the volume is slowing, you should look towards the price slowing or reversing soon too.
Thank you for updating the website!