Trading the USD/INR Currency Pair
Another of the emerging Forex currency pairs, the USD/INR compares the value of the US dollar to the Indian rupee. As you can see from the chart below, there are more than Rs.50 to the dollar, so conventionally the point is only two decimal places rather than four, i.e. the spread betting quote is 5463.2 – 5483.2.
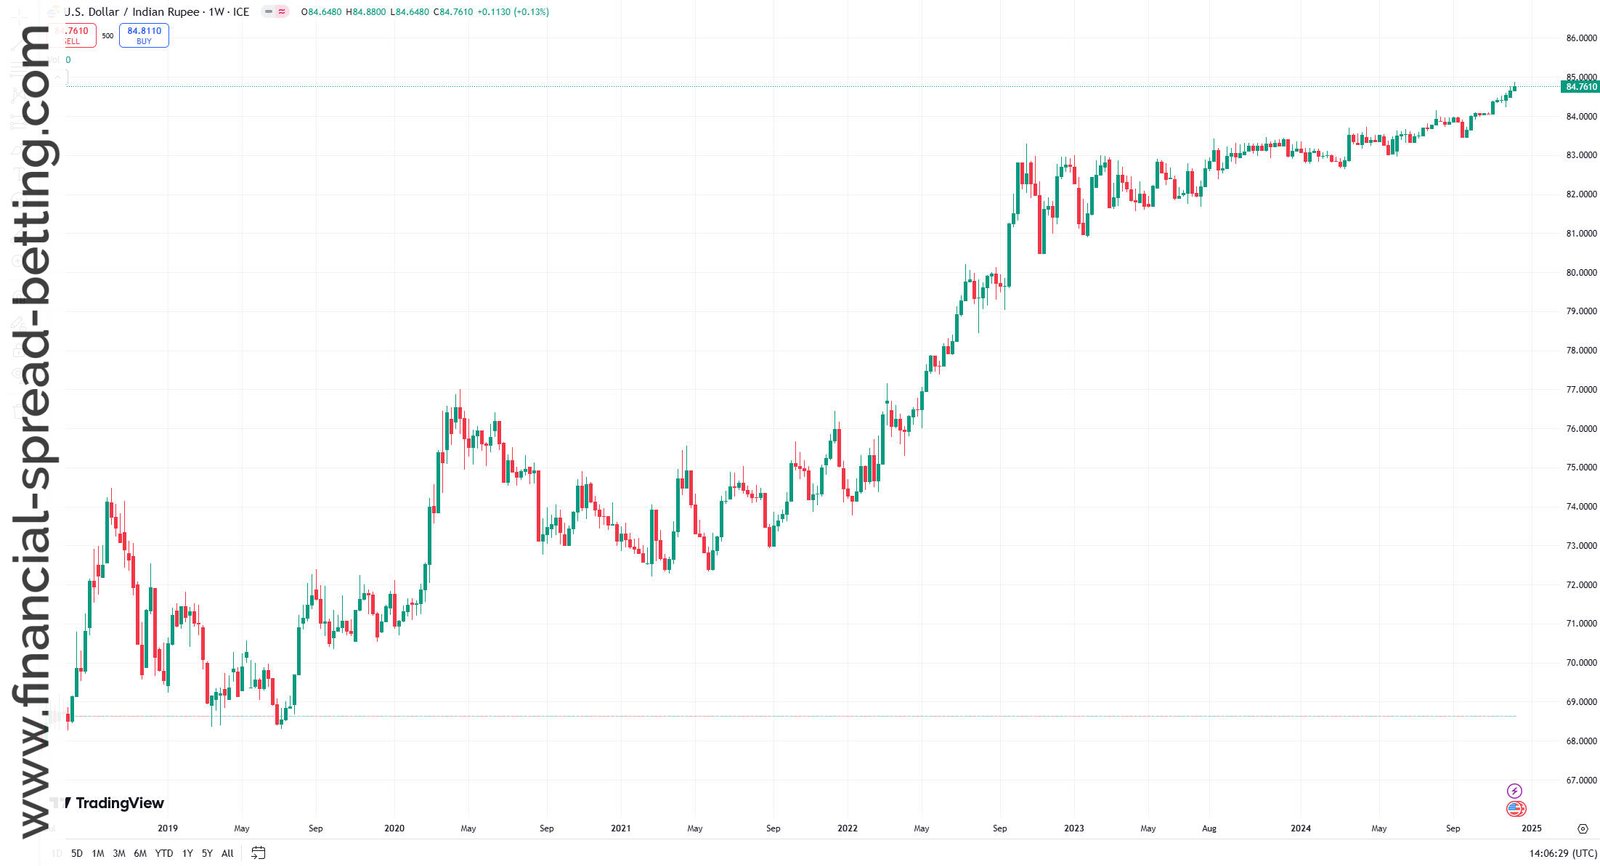
Going back five years, there were only Rs.40 to the US dollar, so as you can see the rupee’s value has fallen in comparison to the international standard. This is good for India’s international trade as it makes goods and services more affordable, although it means that the money earned can buy less in the global marketplace. Nonetheless, India is one of the four countries in the BRIC group which is predicted to develop its economy more than the current world leaders in the coming decades.
India has a policy of allowing its currency to float against other currencies, providing a reasonably volatile Forex pair, politically compared to some of the Eastern Bloc where much tighter control is exercised. Looking at the two-year chart above, you can see that technical analysis has worked well in the past.
For instance, in November 2011 the Bollinger Bands narrowed and this was followed by a sharp breakout to the upside. March 2012 had a similar pattern, though less pronounced, and the prolonged narrowing in August and September 2012 was followed by a sharp downtrend.
Similarly if you look at the MACD pattern plotted below the main price chart, you can see that it reasonably reflects the price chart, and gives clear indications of the up and down trends that were experienced.
It is worth noting that the Indian rupee has been very weak in 2013 and have been in free fall against the dollar having started the year at around INR 55 and falling as low as 61 in July 2013 on domestic economy worries including the huge current account deficit and the over-dependence on capital inflows. A combination of inflation and its commitment to exorbitant fuel subsidies – seen to be out of keeping with its deficit reduction targets are major problems.
The Indian government subsidises fuel to prevent its inflation and boost its manufacturing sector but this is costing the country way too much. And so far the government’s counterinflationary have done little to stop the Rupee losing value against the US dollar. Prices are rising fastest where production is falling most as in agricultural production and this is causing causing the prices of consumables such as wheat, potatoes, Edible oils, meat and fish to increase which hurts the general population.
USD/INR Rolling Daily Spread Bet
When you are spread betting on the foreign exchange markets, you must be careful to keep an eye on international news for any events that may impact the currencies you are trading. Unlike many other underlyings, currencies are particularly susceptible to news events and government manipulations.
Of course it can be exciting to bet on the currencies of emerging markets. Typically, these are more volatile than than those of established old world countries, and you may see some underlying trends while the economies establish their position in the global marketplace. The current quote for the US dollar versus Indian rupee (USD/INR) daily rolling bet is 5463.2 – 5483.2. If you think that the dollar is going to strengthen against the rupee, that is the same as taking a long bet, looking for the number which represents the number of rupees which can be bought for dollar to go up. Say you decide to stake £3 per point on a buy bet.
As the first example, assume that the price goes up to 5613.2 – 5633.2, and decide to close your trade and collect your winnings. Your long bet was placed at 5483.2, and you closed at 5613.2, which is an increase of 130 points. Multiplying this by your stake of £3 per point, your total winnings would work out to £390.
As a second example, suppose the price fell and you were forced to close it for a loss. Say the price went down to 5388.2 – 5408.2, so your closing price was 5388.2. Taking this away from the opening price of 5483.2, you find you have lost 95 points. At your chosen size of stake, this amounts to £285 loss.
As an alternative for closing a losing bet, you might choose to place a stop loss order, which takes care of ending the trade automatically, with your spread betting provider taking responsibility. With a stop loss order, this losing trade might have been exited at 5418.2 – 5438.2, which would save you some money. The closing price this time would be 5418.2, a difference of 65 points from the opening price, and therefore you would have lost £195.
Can we use technical analysis to analyse the Indian Rupee versus the US Dollar?
The Indian Rupee is still not a fully float, so technically it cannot be called a freely traded instrument. For technically, we should have two mina pre-requisites, first, a freely traded and liquid instrument, and second, which has mass participation, without any scope for manipulation.
The Re/$ trade is having mass participation, it is liquid, but is subject to intervention from the Reserve Bank of India, as it is still not a full free float.
On the other hand, the spot forex markets, traded all over the world, have a lesser chance of intervention, because of the sheer size of the markets. As an example, should the Bank of Japan intervene in the USD/JPY market, the effect of the intervention is very short lived, and the market seeks the technical levels again.
Join the discussion