The Trap Closes
We have traded WMT in the past both long and short. But the upside potential for the stock is now so great that we resolve to hold our shares strongly and to increase our position as new evidence adds to the bullish case.
From P, the point of our initial position, the stock rallies to 12 and a fraction, recovering about one half of the decline from K to O. This normal recovery takes the stock back to an area of supply (N). We expect price either to consolidate or to back up as supply at this level is absorbed. A reaction carries to Q, a level at which WMT earlier met support (at M and P). Volume decreases as the stock churns near support, a sign that selling is light. Nothing in the action of the stock suggests that sellers are in control.
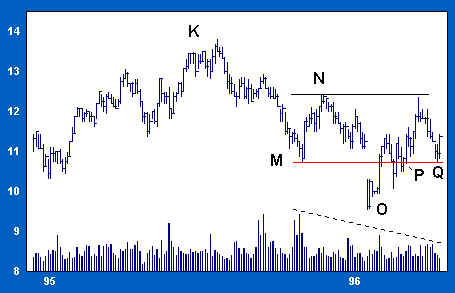
Support between 9 1/2 and 10 1/2 has been attacked and tested repeatedly over a period of five to six months, from M to Q. Each time, selling thrusts have been turned back. We have ample demonstration that strong hands are in control. Upon the successful test at Q we add to our long position as the stock rallies from support.
The rally carries price above resistance (N) with no trouble (see below). Price-volume action on the rally is even and controlled, suggesting steady accumulation on the way up. As WMT approaches 13 (R), volume spikes. Some increase in selling pressure is to be expected as price nears the old high (K). The rally is still fragile, and we remain alert for signs of undue selling activity.
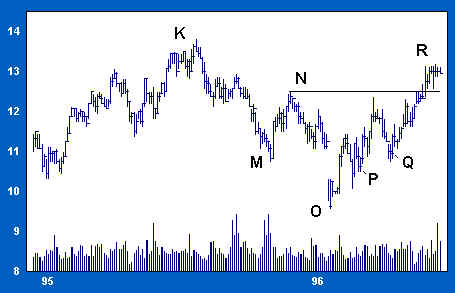
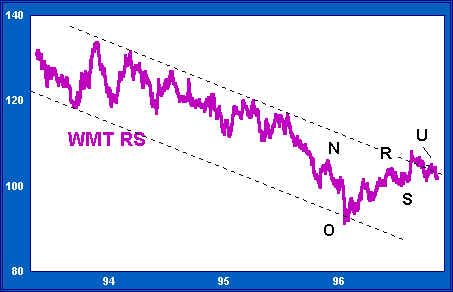
Indications from WMT’s relative strength chart are mixed. The rally, in relative terms, is the best since at least late 1994. But the recovery to R has not improved on WMT’s relative position at N. This is a weak divergence from the stock’s nominal performance.
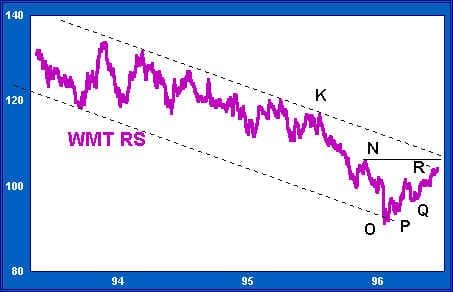
Relative price is approaching the supply line of its long-term downtrend. WMT’s relative strength chart suggests that there are important hurdles just ahead.
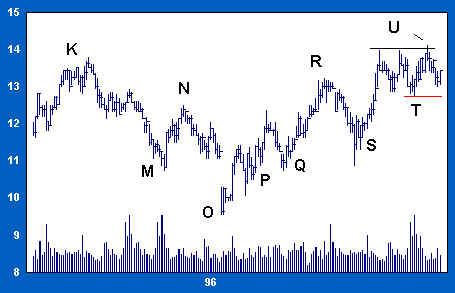
On the reaction to S, WMT gives back half the advance from O to R (see below). This correction appears quite normal in every respect. Volume is muted and support around 11 is reasserted. We maintain our position. But before adding shares to our long position, we want to see evidence that supply between 13 and 14 can be overcome.
The rally from S quickens as price breaks through supply at 13, and moderate volume tells us that selling is light. For the next two months WMT trades between 13 and 14. We cannot be sure whether this stalemate will resolve in an advance or a decline. But longer-term indications remain bullish, so we hold tight.
The RS chart (below) is encouraging. After trending down for three years, WMT broke above the supply trendline on the rally to 14. Longer-term implications are bullish.
But the nominal new high at U (above) is not confirmed by WMT’s relative strength chart (below). RS at U fails to match the high reached on the initial thrust to 14, a negative divergence which suggests that the nominal upside breakout at U may be a shakeout. If so, this may lead to at least a short-term correction.
This development presents a problem for us. We are impressed by WMT’s longer-term prospects, but the divergence at U alerts us to possible near-term weakness. We decide to place a close sell-stop order at 11 5/8, just under support established at T. We do not stop our entire position, but only half, enough to recognize and to adjust to the risk of near-term weakness.


Join the discussion