Cycle Trading
Identifying Cycle Tops and Bottoms
Editor’s Note: For years Walter Bressert has been an innovative leader in the development of trading systems based on cycles. Walter’s work is difficult, but offers an excellent example of creative system-building. Even for discretionary traders–those who do not employ mechanical systems–Walter’s insights and indicators add much to the understanding of market dynamics.
Introduction
There is no magic oscillator or indicator that will bring you success in the markets. Knowledge of trading techniques and tools to improve TIMING and determine TREND are the keys to low risk, high probability trades that can bring you success.
Knowledge, self-discipline and persistence are the true keys to success in trading. Over time you will develop a trading style that fits your personality and trading skills. There are many tools to help improve your trading, and cycles are one tool that will help you to add the element of TIME into your trading.
With cycles you can identify the trend plus forecast and confirm trend reversals. Whether you are trading weekly, daily or intra-day time frames, it is the cycle in the longer-term time frame that sets the trend for trading the shorter time frame. Knowing the direction of the longer cycle you will know the trend for trading the shorter cycle.
Simple buy and sell signals do not consider the whole picture. By combining trading signals with daily and weekly cycles (or two intra-day time periods and cycles, such as a 45- minute and 180-minute, or a 5-minutes and 20-minute), retracements, trend indicators and trendlines into Cycle Trading Patterns, you can greatly improve your accuracy and odds of making money in a discretionary trade or with a system. The trading concepts introduced in this section are based on trading the long side of a market. The same techniques and concepts work in mirror image fashion for trading the short side.
Detrending Takes The Mystery Out Of Cycles
Historical cycles show great potential for low risk trades. But to make cycles tradable it is necessary to define the tops and bottoms so they can be identified and traded with buy and sell signals.
Chart 1
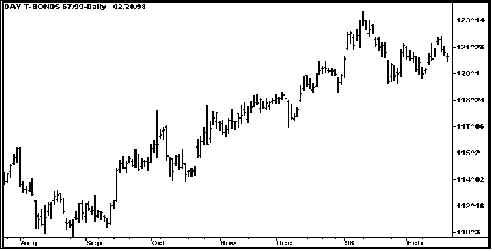
This chart shows the ebb and flow of prices, but identification of the Trading Cycle bottoms and tops requires a little effort to be visible to the untrained eye.
Chart 2
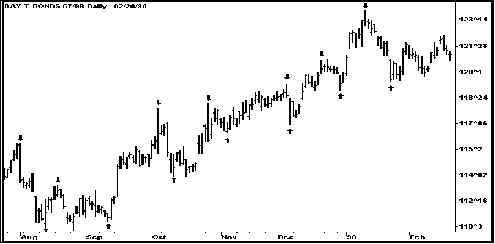
Cycles are measured from bottom to bottom. Every time frame of every market has a dominant Trading Cycle averaging from 14 to 25 bars as measured in weeks, days, half days, hours, minutes or ticks. Most Trading Cycles in the stock and futures markets tend to cluster in the 18 to 22 bar range, averaging 20 bars from bottom to bottom. In Chart 2, T-Bonds exhibits a daily trading cycle of 21 days from bottom to bottom. The trading cycle tops and bottoms are indicated by the arrows.
For over 50 years the non-profit Foundation for the Study of Cycles has been using a simple procedure called centered detrending to identify cycle lengths in all natural phenomena, including economic activity. The advantage of centered detrending over Fourier analysis and Spectral analysis is that you can visibly observe the historical cycle bottoms and tops. This takes the “mystery” out of cycle trading and analysis. When you can look back over 20 years of price history and actually see the consistency and tradability of cycles, it is easy to have the confidence to trade them. After all, if you cannot see cycles in price activity how can you put your money on the line to buy a bottom or sell a top? We are not looking to trade the big bottoms and tops that occur as the trend reverses, but the bottoms and tops of the shorter-term cycles occurring in the direction of TREND.
Chart 3
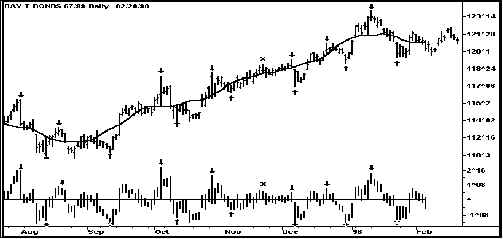
Centered Detrend -Trading Cycle tops and bottoms are easy to see in the centered detrend.
The process to detrend a cycle is simple.
- Calculate a moving average the same length as the potential Trading Cycle. For most markets use a 20-bar moving average of the close. But instead of plotting the moving average on the day of the last calculation, it is centered (or plotted) in the middle of the cycle. For example, the 20-day moving average is plotted back 10 days from the most recent close. This is called a centered moving average because it is plotted in the center of the cycle.
- Subtract the moving average from the high and low of each price bar and plot the results around a zero line directly below each price bar. The zero line represents the centered 20-bar moving average.
- The centered detrend at the bottom of Chart 3 mitigates the effects of trend and allows the highs and lows of the trading cycle to be easily seen.
This process can be easily programmed into many of the popular trading platforms. The WB_Cen-MA indicator calculates the moving average and centers it back one-half the length of the cycle as in Step 1. The actual centered detrend is plotted by the WB_CenDetrend indicator, as in Step 2.
The chart below has been compressed to show more cycles. The highs and lows of the centered detrend correspond to the highs and lows of the trading cycle. Most cycle tops occur above the sell line at .80 and most cycle bottoms occur below the buy line at -.80. A rise above 2.0 indicates a top is imminent; a bottom is ready to occur if the detrend drops below –2.0.
Chart 4
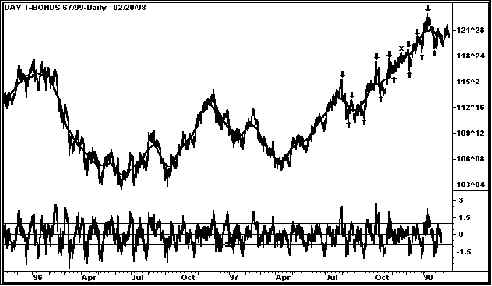
Compressed Chart with Centered Detrend – Cycle tops and bottoms occur at the highs and lows of the detrend which shows limits to how far prices can move above and below the centered moving average (which is the zero line in the bottom centered detrend).
If you are thinking that this is the indicator for which you have been searching… there is one problem. Because the centered detrend lags prices by one-half the length of the cycle, or 10 bars, the centered detrend is excellent for showing historical cycles, but cannot be used for real-time trading.
However, we now have something to look for — A real-time oscillator that matches the centered detrend and the cycles.
Oscillators Show Cycle Tops and Bottoms
The standard oscillators in TradeStation, SuperCharts or any charting package can be overlaid on the centered detrend (or on top of prices) in the search for an oscillator that tops and bottoms as the trading cycles top and bottom. Not surprisingly, the performance of these oscillators for identifying trading cycle tops and bottoms can be improved by a few simple techniques.
To use an oscillator to identify cycle tops and bottoms look for three characteristics:
- The oscillator turns when prices turn
- The oscillator does not “wiggle” much at cycle tops and bottoms
- The oscillator has amplitude moves that take it to the extremes of an allowable range as the cycles bottom and top.
Overlaid on the centered detrend (CDT) is such an oscillator. It is a regular RSI 3 smoothed with a 3-bar moving average called the RSI3M3. It shows the bottoms and tops of the trading cycle almost as well as the centered detrend and can be used as a mechanical trading signal and cycle identifier… And the RSI3M3 is current to the most recent price bar, turning down in this chart to identify the most recent trading cycle top missed by the centered detrend.
Chart 5
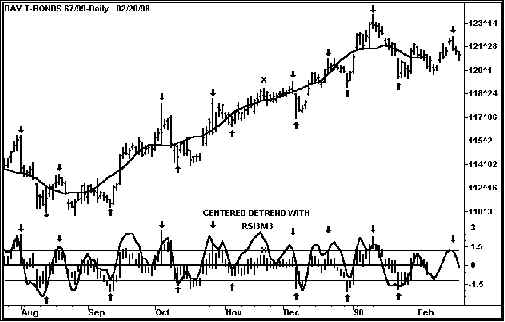
The RSI3M3 oscillator is current to the most recent price bar and shows cycle tops and bottoms as well as the centered detrend.


Join the discussion