Gauging The Trend 1
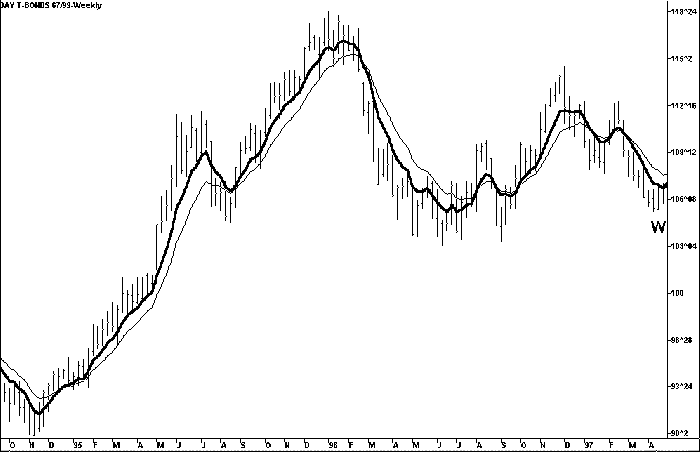
Since the trend is the direction of the next longer dominant cycle than the one you are trading, the beginning of an uptrend is often confirmed by a buy signal in the next longer time frame. In the weekly chart at the two lows indicated by W, the direction of trend for the daily chart was confirmed when prices exceeded the high of the weeks with the mechanical signal dots.
Another indicator of an uptrend is that the trading cycle highs and lows in the daily chart are above the previous trading cycle tops and bottoms. Following an uptrend, a drop below a previous trading cycle bottom will most often indicate the end of a trend and is likely to be followed by a period of consolidation or a downtrend.
Chart 12
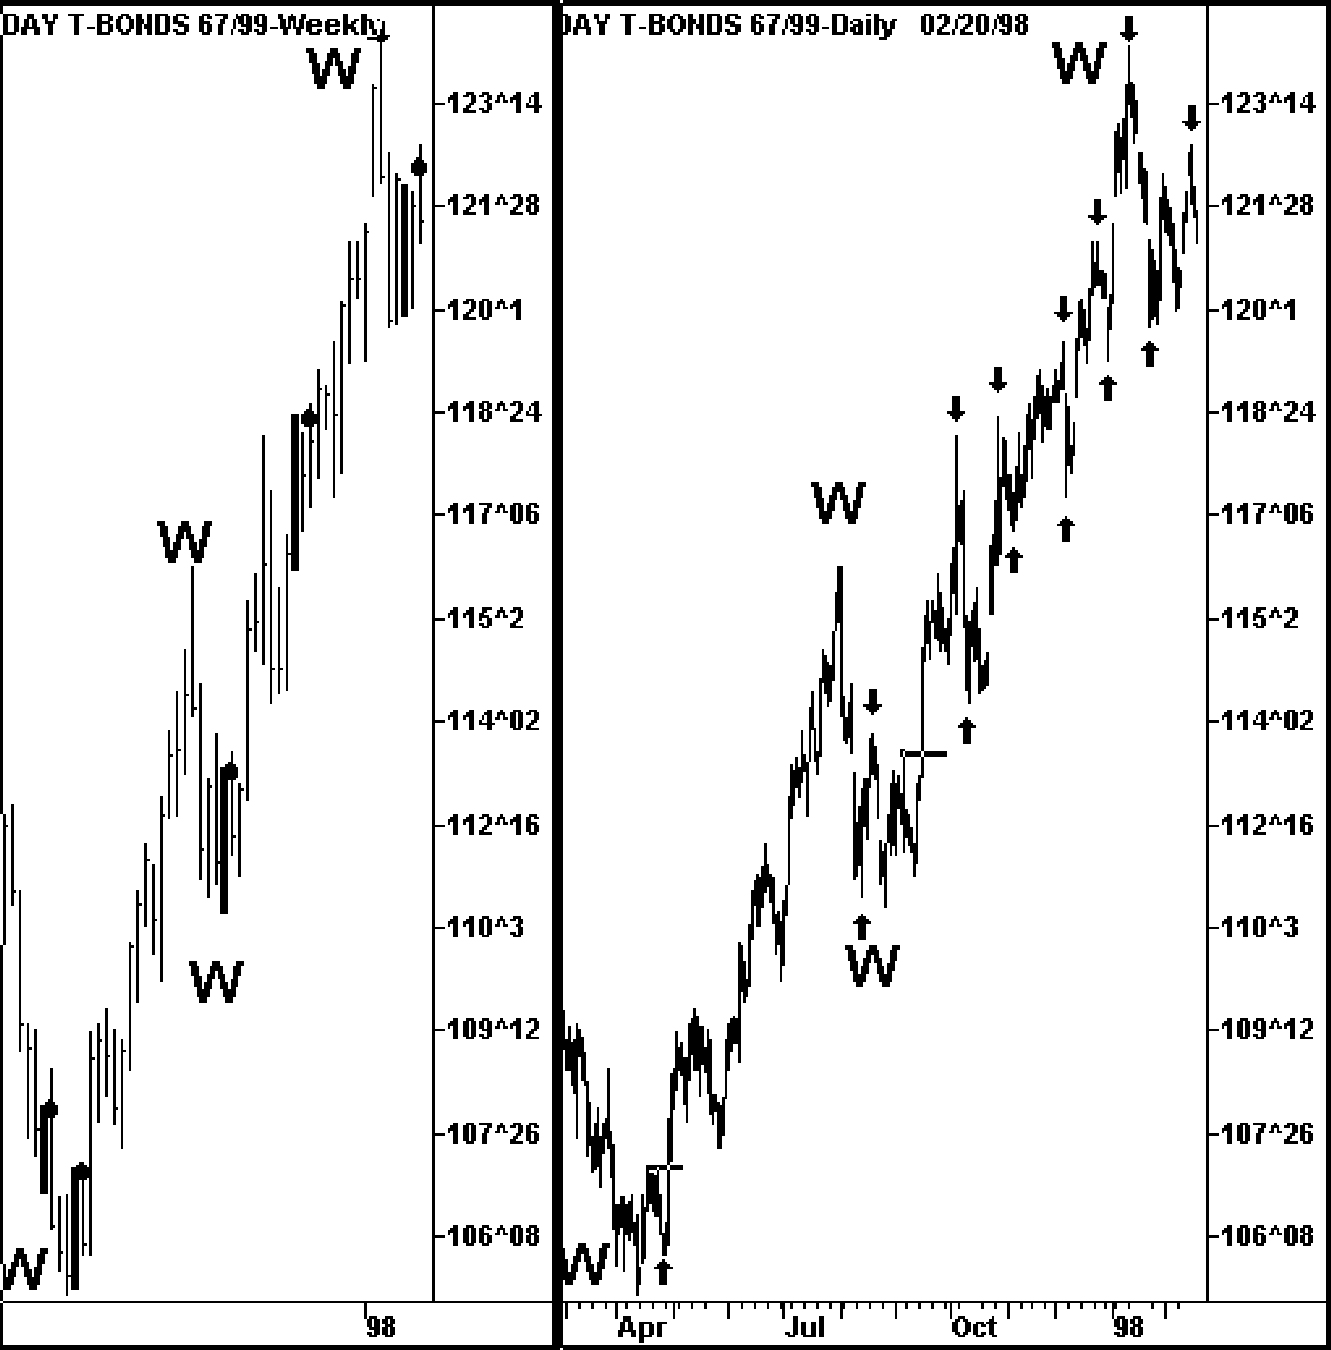
The weekly chart sets the trend for the daily chart.
Three Trend Indicators
1. EMA Trend Indicator
The determination of trend is so important that I have developed a trend indicator that plots on the trading chart to visually show the trend direction of the longer-term cycle that sets the trend. The EMA (Exponential Moving Average) trend indicator allows you to see the development of the trend on the chart you are trading with characteristics for fast trending markets, trading range markets and signals for the beginning and ending of trends. It also allows you to identify the highest probability trading signals to trade in the direction of trend.
Moving averages turn slowly, but can be reliable trend indicators that accurately show trend. These indicators will reverse direction slowly, but using them in a pattern with mechanical entry signals and 38% – 62% retracements can give high probability cycle trading pattern signals.
The weekly chart that follows shows two exponential moving averages (EMAs). When the faster (thicker) moving average is moving up and above the slower (thinner) moving average the trend is up, and when it is below the slower moving average and moving down, the trend is down.
Chart 13
You can see on this weekly chart how following these exponential moving averages will keep you trading in the direction of trend and can also keep you in a long-term position for the big moves.
Chart 14
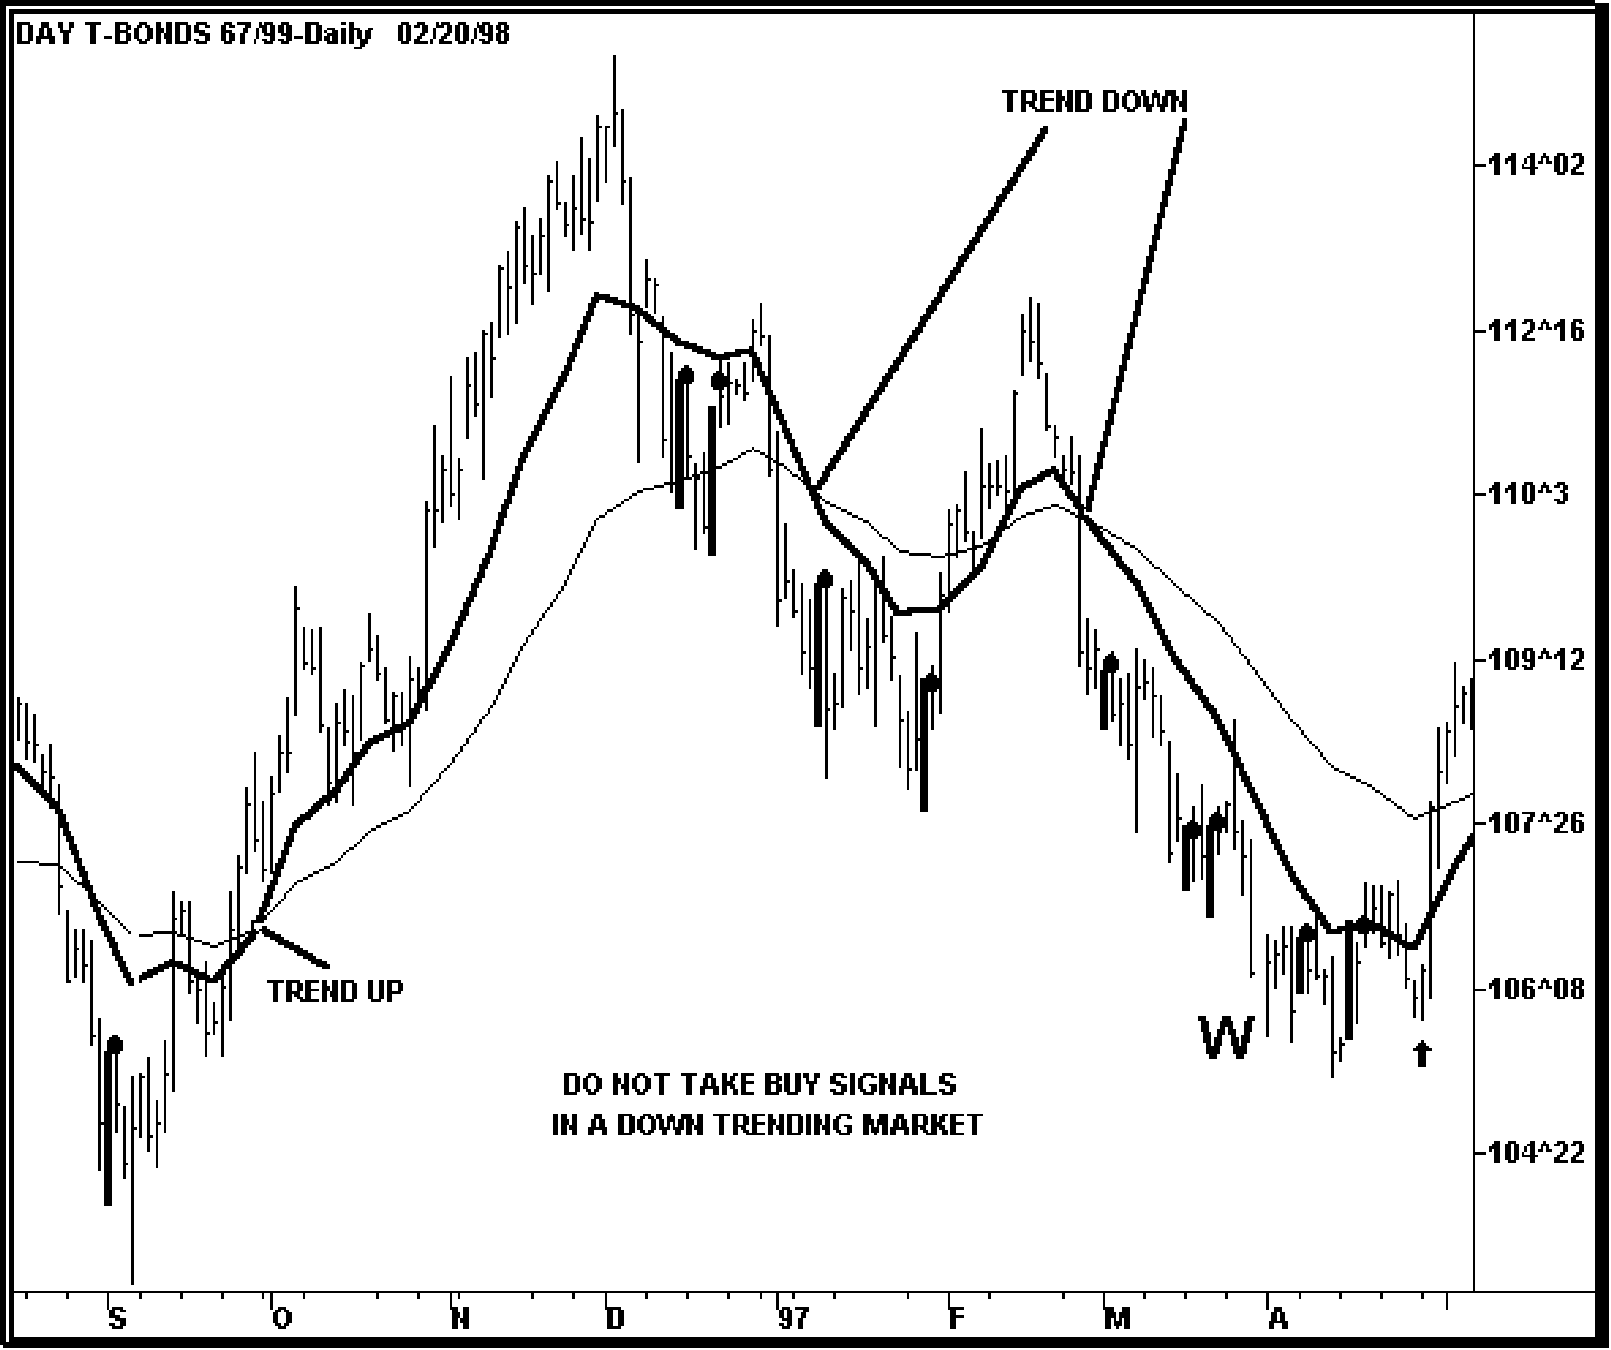
The weekly moving averages plotted on a daily chart show trend. Six of the eight buy signals in the downtrend were losers, illustrating why you do not want to take buy signals in a downtrending markets.
2. EMA% Trend
An oscillator can be created by calculating the percentage difference between the thicker line and the thinner line. Plotted below prices it is also a trend indicator, showing a slowdown of the uptrend and indicating a trend reversal by the turn downs at A and B. Trend reversals can be followed by a downtrend as at A, or consolidation as at B as the weekly cycle drops into a bottom before continuing higher. While cycle bottoms in consolidation can be bought, the safer trades occur when the EMA% Trend is moving up.
Chart 15
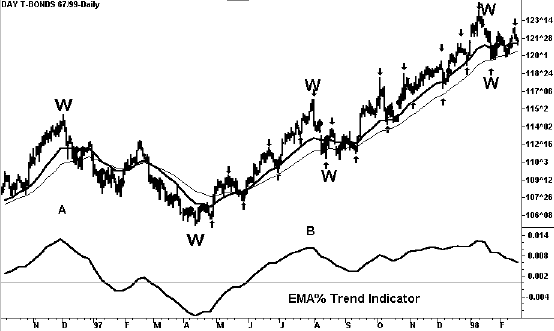
Following a strong uptrend a downturn in the EMA% Trend can be an early warning of a trend reversal, as at A and B.
3. MACD Trend Indicator
Another popular indicator that shows the trend well is the MACD. Plotted at the bottom of the chart below, the points where the thick line crosses the thin line show the potential for a trending move to continue. When both the MACD and the EMA trend indicators are moving in the same direction, the odds strongly favor a trending move.
Chart 16
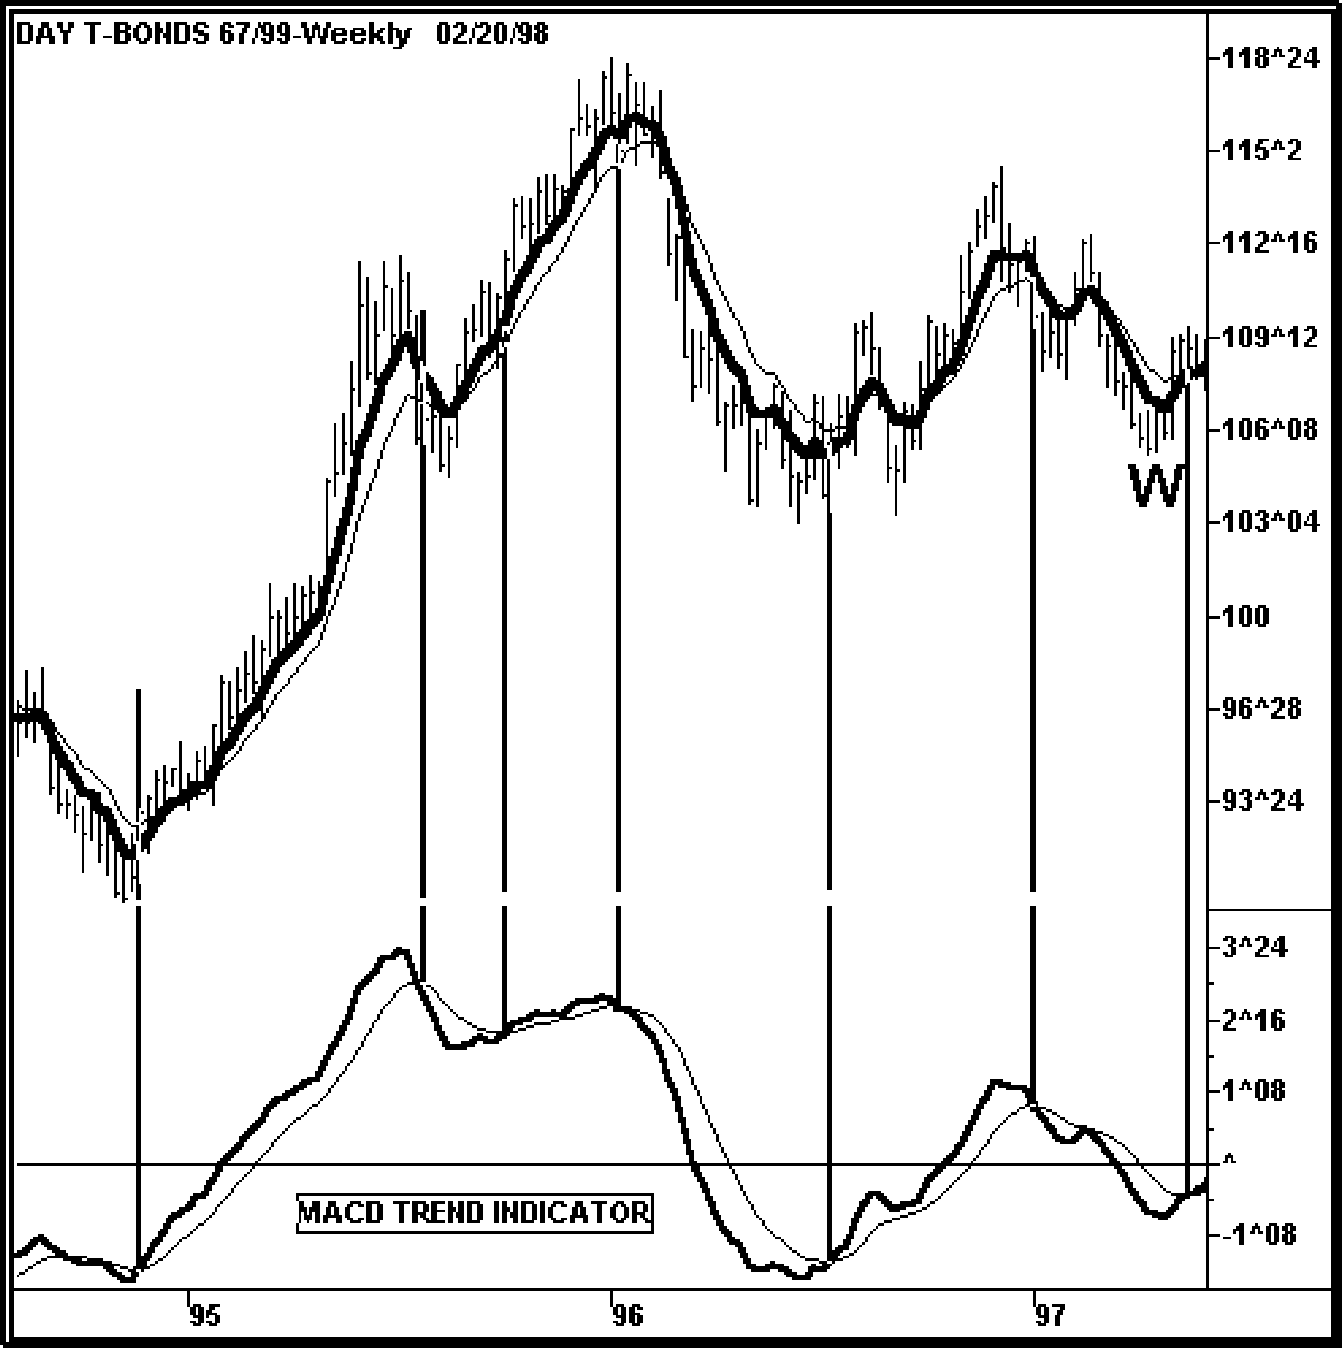
When both the MACD and the EMA averages are moving in the same direction, the odds strongly favor a trending move.
Plotting these weekly trend indicators on a daily chart gives a clear picture of the direction to trade. The chart below shows weekly trend indicators overlaid on a daily chart, with trading cycle tops and bottoms indicated by the arrows.
Chart 17
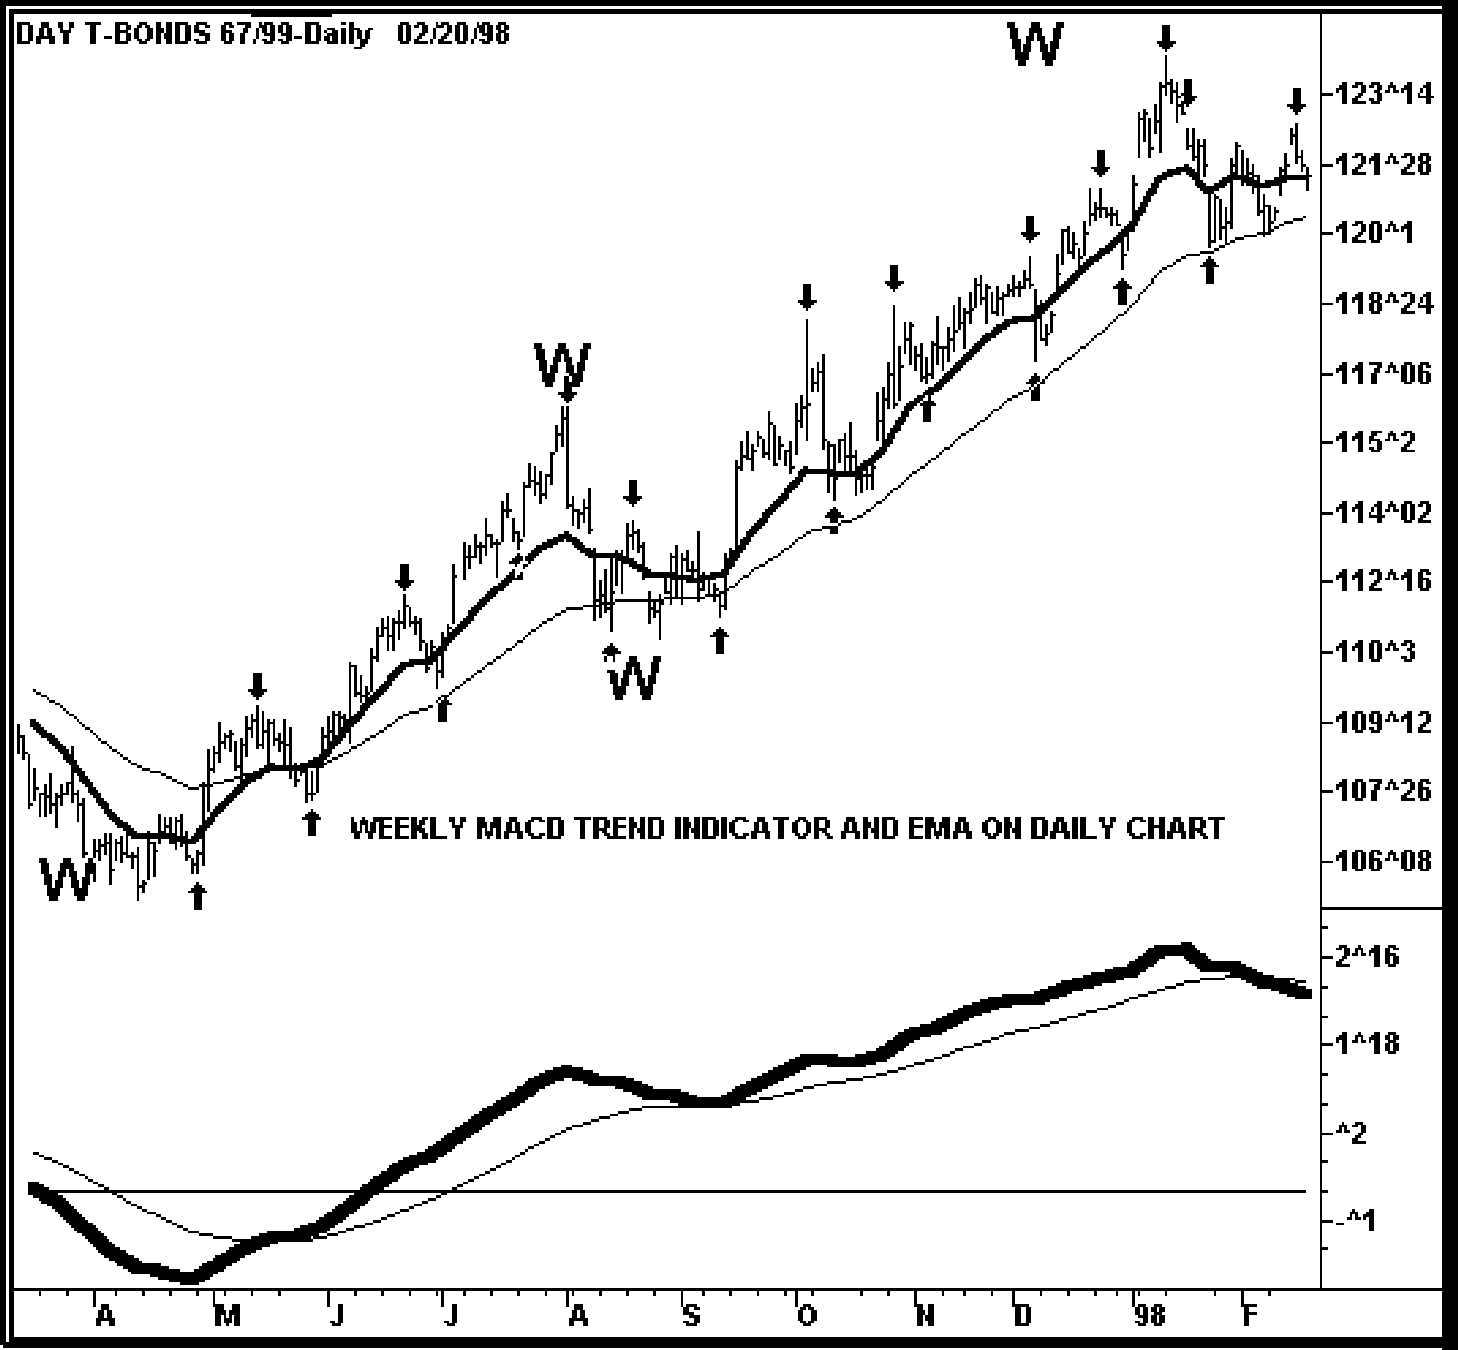
Trading Cycle bottoms that drop below the thicker EMA line offer low risk trades that are often followed by sizable up moves.


Join the discussion