
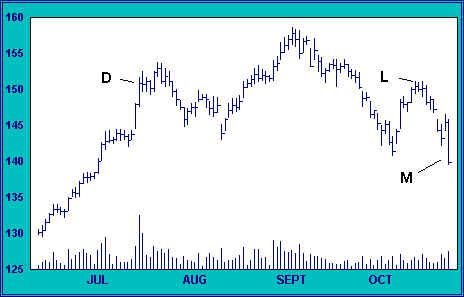
After we sell short at L, we have only to wait for the index to tell us whether our judgement is correct. Our stops are placed above near-term supply, at a price just over 155.
The index begins to ease downward on only modest volume. Volume must be considered in context, and our interpretation is influenced by months of technical erosion. Light volume here is an indication that the initial decline is encountering little resistance. Bidders are weak. Price gaps down to a test of the early October low, but bargain hunters cannot sustain more than a one-day rally before the index breaks to a new low on increased volume (M). Liquidation has begun in earnest.
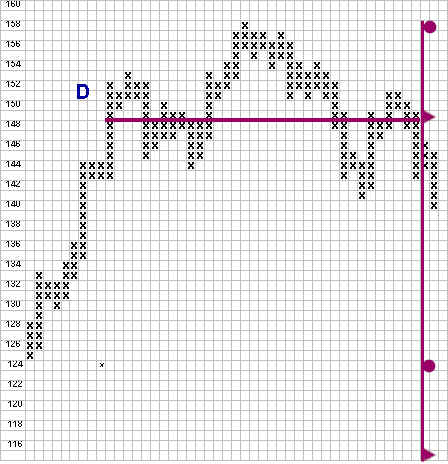
Point and figure analysis shows that the broad band of distribution between 141 and 158 spans 35 columns, from the vertical ascent which terminated with the first point of distribution at D to the last point of supply. Targets may be measured from the high of 158 as well as from the axis, the level at which our count of 35 is taken (149). Our first objective is 124, and our second is 115. Using these measurements, our profit potential for the trade is between 17 and 23 percent. Our risk is 6 points, or just under 5 percent. Our profit potential is four to five times this risk. This is a very favorable risk to reward.
Selling comes with the force of a Niagara. The first target of 124 offers no support at all. The index gaps down on heavy volume to N. The action is climactic. Shares are being sold at the market by panicky traders. After a two-day automatic rally, the index resumes its decline. Trading is gappy and frantic as prices plunge to new lows. Our second target of 115 is passed with only slight hesitation.
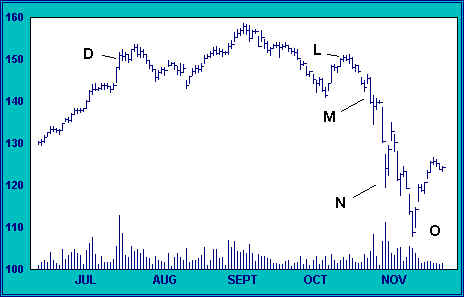
On the selloff below 110 (O), volume increases, though to a level below the volume highs of the first climactic sell off at N. We suspect that this is a climactic aftershock, and a potential trap for late sellers. Our most ambitious downside target has been exceeded, and we look for any sign that prices are turning up. Any sign of sustainable strength will cause us to cover our short position.
I have not yet identified the index featured in this chapter, though by now you may have guessed the period we have been studying, if not the index. The subject of our study has been the New York Times Industrial Index from early June to late November, 1929.