Trading Signals
RSI (Relative Strength Indicator) is a powerful oscillator which can be used to identify cycle highs and lows (to review RSI, see Basic Training: Overbought/Oversold Indicators 1). I have found that for most markets, a three-day RSI smoothed by a three-day average (RSI3M3) works very well.
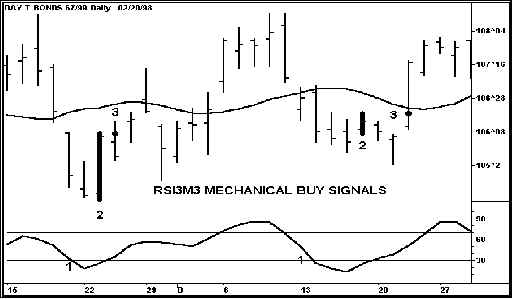
There are four steps to construct a mechanical buy signal illustrated on the following chart (6) with buy signals using an RSI3M3 oscillator:
- The RSI3M3 drops below the buy line at 30. By dropping below the buy line the oscillator shows an oversold condition common at cycle bottoms.
- The oscillator turns up to show the market momentum is reversing. The price bar that turned the oscillator up is colored or thickened to show that it is a setup bar.
- A buy stop to go long is placed one tick above the high of the setup bar. By waiting for the high of the setup bar to be exceeded, instead of trading on the close, the accuracy of the buy signal is increased from 10% to 25%, depending upon market and time frame.
- Once a market is entered a protective sell stop is placed one tick below the cycle bottom. Sell stops would be placed one tick below A and B. In A the setup bar was also the cycle bottom and entry occurred the following day. In B the setup bar occurs two days before the cycle bottom, but entry occurs the day following the cycle bottom.
Chart 6

Trading Signals reduce judgement and put you in control because you always know the risk (entry price to protective stop).
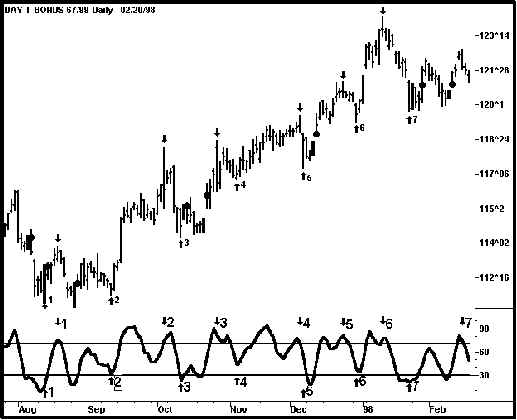
In the next chart (7), the up arrows identify the seven trading cycle bottoms labeled 1 through 7 in the oscillator panel. The down arrows show the cycle tops. The setup bars are the thicker price bars, and the entry day and price are shown by the dots that follow them. There are eight buy signals, of which six (75%) could have made money. Four occurred at trading cycle (TC) bottoms; three followed the trading cycle bottoms and were followed by higher prices. Only one occurred before the trading cycle bottom.
But trading cycle bottoms 2, 4 and 6 were missed by this buy signal because the oscillator did not drop below the buy line. Simply raising the buy line would not have helped, as over the long term a higher buy line at 40 or 50 would have more losers than the lower buy line at 30.
But these bottoms can be identified and traded by detrending the RSI3M3.
Chart 7

RSI3M3 Buy Signals – Four of seven trading cycle bottoms were identified with these buy signals. The dark setup bars are followed by entry at the big dots. Six of the eight signals could have made money.
Detrended Oscillator Generates Trading Signals In Strong Trending Markets
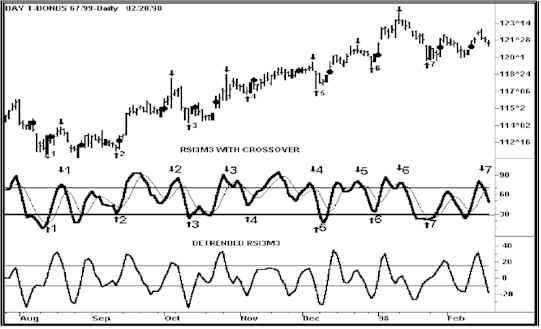
In chart 8 below, the RSI3M3 is in the middle of the chart and a crossover has been added. A crossover is simply a moving average of the oscillator. This crossover is a 5-bar moving average of the RSI3M3. To detrend the oscillator the crossover is subtracted from the RSI3M3 oscillator to produce the detrended oscillator at the bottom of the chart. In a strong trending market this detrended oscillator will identify most trading cycle bottoms with the same type of mechanical buy signals as the RSI3M3. Since the most accurate buy signals occur in the direction of the trend, this detrend plays a very important role in successful trading. Since it is more sensitive than the RSI, it often gives buy/sell signals for the ½ trading cycle. (More on this later.)
Chart 8

The RSI3M3 Detrend generated 12 buy signals with nine that could have made money.
The RSI3M3 Detrend generated 12 buy signals (solid setup bar with entry dot), with nine (75%) that could have made money. Six of the seven trading cycle bottoms were identified by this buy signal… Most importantly, it identified and generated buy signals for trading cycle bottoms in a strong uptrending market that were missed by the RSI3M3. Six of the buy signals occurred at bottoms of the ½ trading cycle.
Between the buy signals of the RSI3M3 and the RSI3M3 Detrend all seven trading cycle bottoms were identified and followed by a buy signal. Six of the seven ½ trading cycle bottoms were also identified with buy signals.


Join the discussion