Our initial position in GE was taken in two parts, the first just after the evidence of a shakeout...

Our initial position in GE was taken in two parts, the first just after the evidence of a shakeout...

The point & figure chart below gives us some sense of the near-term rally objective we may...
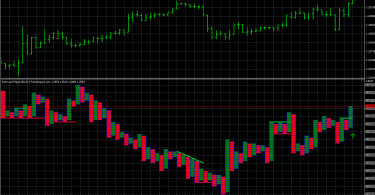
Volume on the decline to F is light, a good sign. Sellers are not aggressively pursuing the price...

The shakeout was a tactic often employed by trading pools. Harriman, in particular, favored the...

The selling climax at point A in the chart below is typical; volume increases dramatically as the...

The Art of Buying These days, investors rarely form together into groups for the purpose of...

The bar chart has two elements: 1) the price bar, including high, low and closing price; and 2) the...
When stocks are low in their cycle, shares move from weak hands to strong hands. Strong hands are...

In the bad old days, before the SEC policed stock manipulation, investment pools were formed for...

This course will show you how to form profitable judgements from price and volume data published by...