Knowing how to value a stock or an asset is absolutely vital in deciding when to buy and sell, to make a profit and avoid a loss. Investors research and buy shares into companies they believe will continue growing while selling...
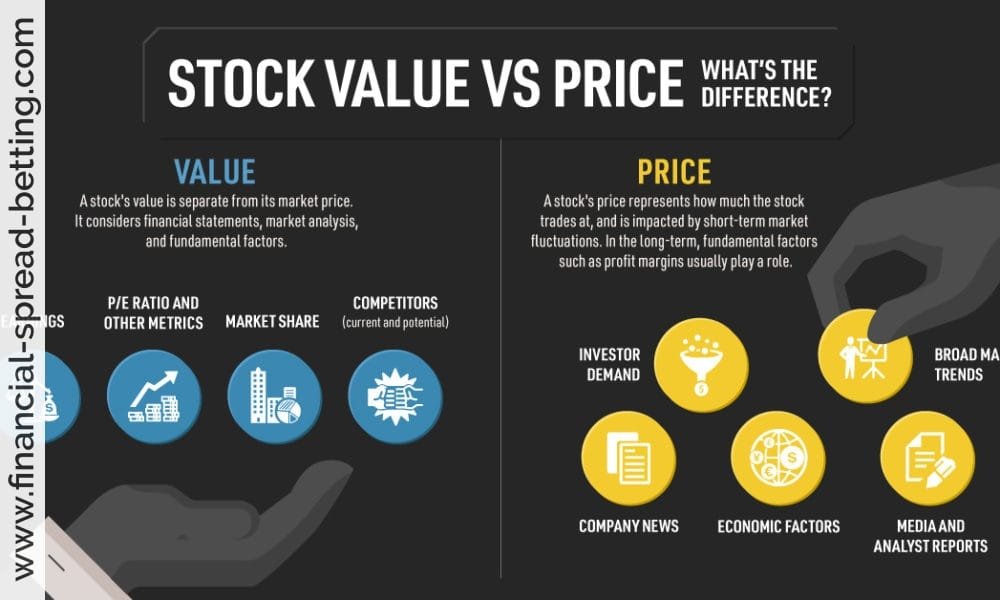
Knowing how to value a stock or an asset is absolutely vital in deciding when to buy and sell, to make a profit and avoid a loss. Investors research and buy shares into companies they believe will continue growing while selling...
Below is a forex glossary of the most common terms which I trust you should find useful AUD Australian Dollars CAD Canadian Dollars CHF Swiss Francs Currency Account/Lot The amount of currency traded on. The amount can be either...
The Forex market is a very fluid market with high volumes of buyers and sellers. The spread is greatly affected depending on whether there is mainly buyers or sellers of the currency pair at any one time. A market that is mainly...
Forex trading is a type of currency trading based on the exchange rate between two currencies. In Forex the points are known as the pips and are worked out in different ways depending on the currencies being traded. The pip is...
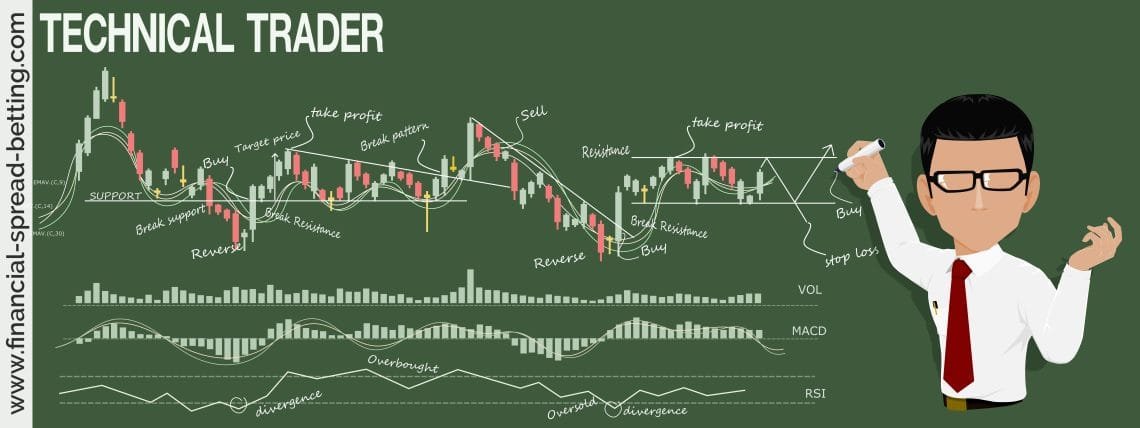
Market Trends When trading forex there are two main types of market that it is important to be able to remember and recognise. The first is known as a Broad Range Consolidation Market, or simply a range bound market. Trades in a...
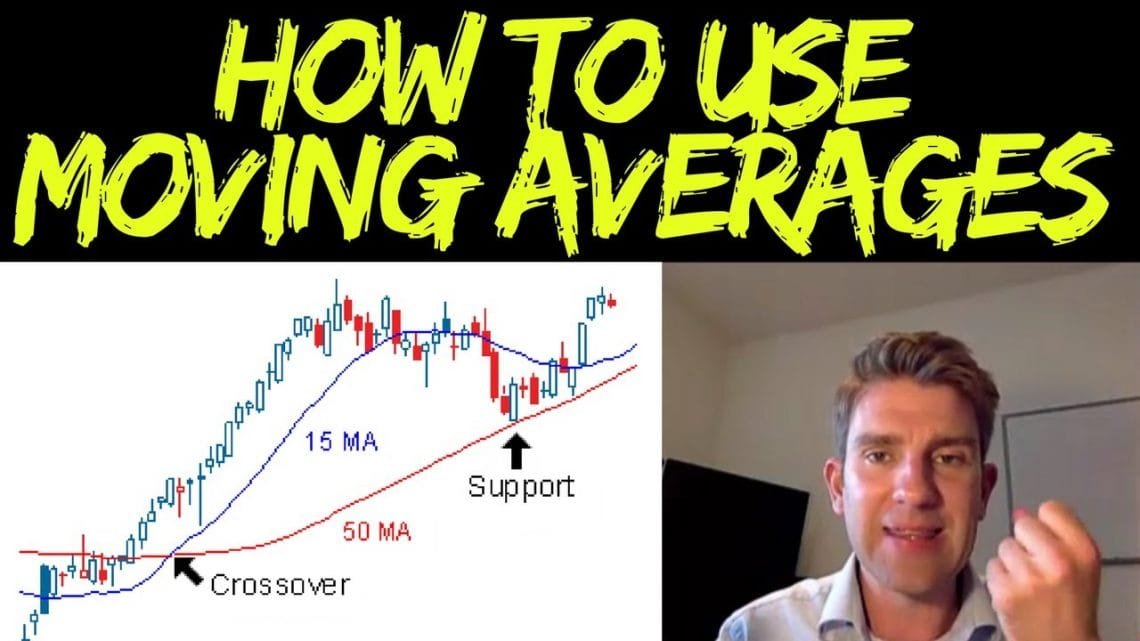
Moving averages depict an average closing price for a currency pair over a specific time period. Simple Moving Averages take all the specified time period into account and average out the data for the whole time period...
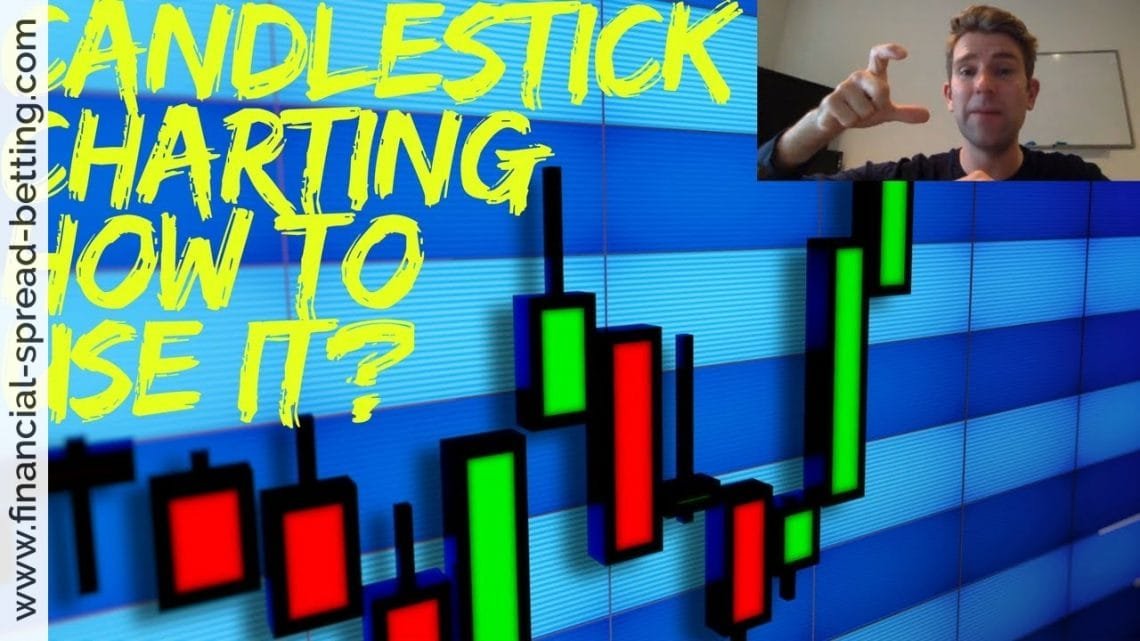
The use of candlesticks in charting applications is becoming evermore popular. Candlesticks are simple and easy to use with the colour coding making trends more obvious. Traditional traders may be more familiar with line or bar...
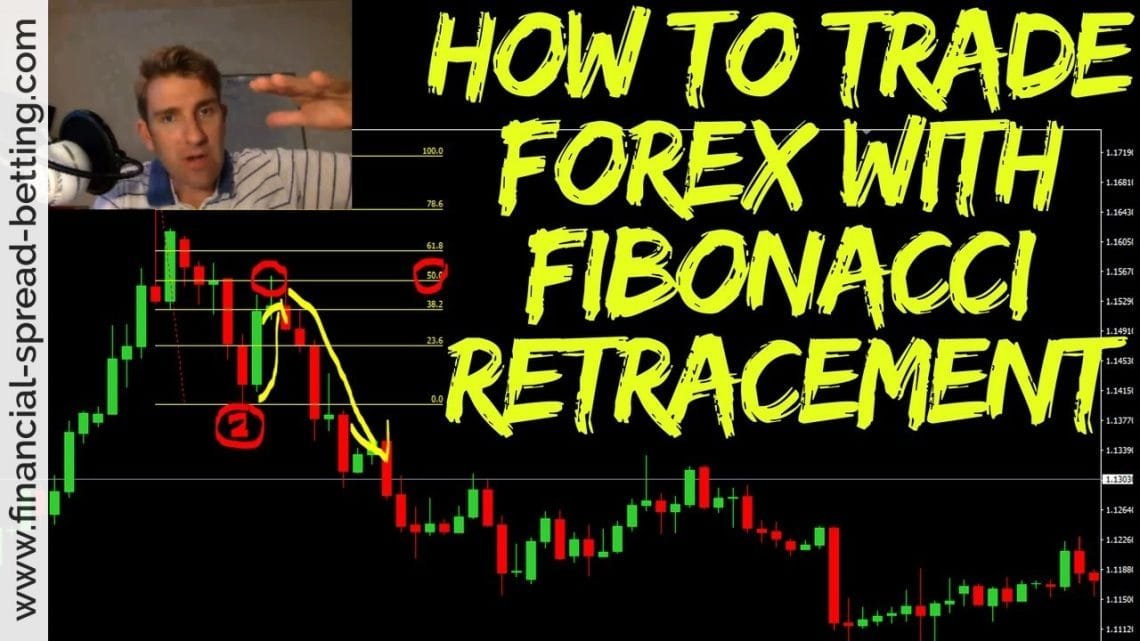
Fibonacci retracements are lines drawn on candlestick charts that show likely points of support and resistance for a trade. The initial Fibonacci line needs to incorporate the whole trade being looked at. The starting point for...
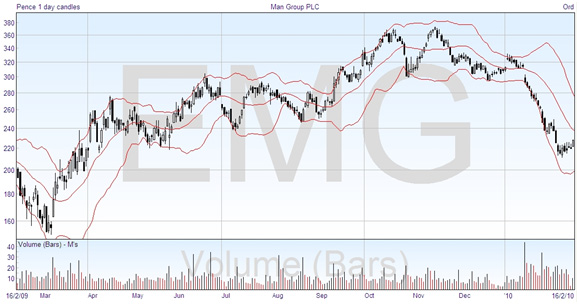
Bollinger Bands are another method of interpreting and analysing market activity. Bollinger Bands are lines that trace the points of resistance and support .The area in between the Bollinger Bands reflects the market activity. If...
Stochastics are a pair of indicators that usually fall between the levels of 80 and 20 on a chart. The pattern that stochastic indicators follow can be used to predict the market trend. If the stochastic indicators break out...