Kondratieff Wave Nikolai Kondratieff is alleged to have discovered a 54 year cycle which affects much of economic activity. Working in the 1920s, he examined records of prices back to 1789. The cycle is supposed to influence...
Kondratieff Wave Nikolai Kondratieff is alleged to have discovered a 54 year cycle which affects much of economic activity. Working in the 1920s, he examined records of prices back to 1789. The cycle is supposed to influence...
The Basics of Cycles Cycles have three characteristics, amplitude, time, and phase. They are often represented by a sine wave on a graph. Amplitude is the height of the wave, time is the cycle length which is usually measured...
Cycles of Time Up to now, time has been an intrinsic and accepted part of our discussion, but we haven’t focused on it. Most of the information has been about price movement, and time has been included by default. But some...
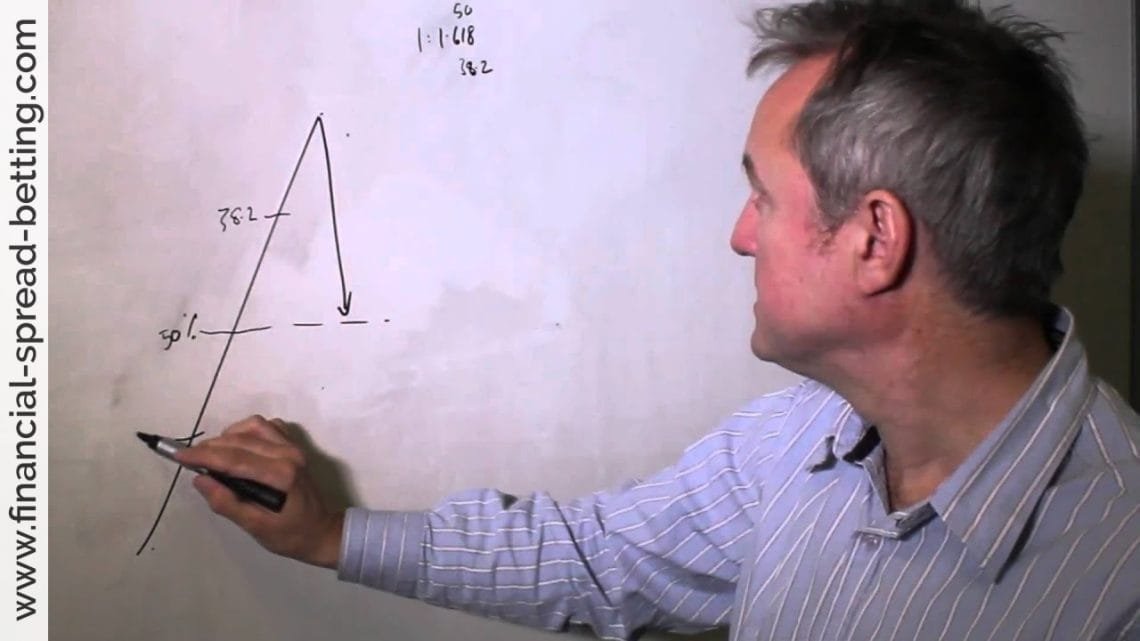
Perhaps the least important part of the wave theory, nonetheless Elliott considered pattern, ratio, and time in his work. He used the Fibonacci series and counted forward from significant peaks and troughs, so that the 8th day...
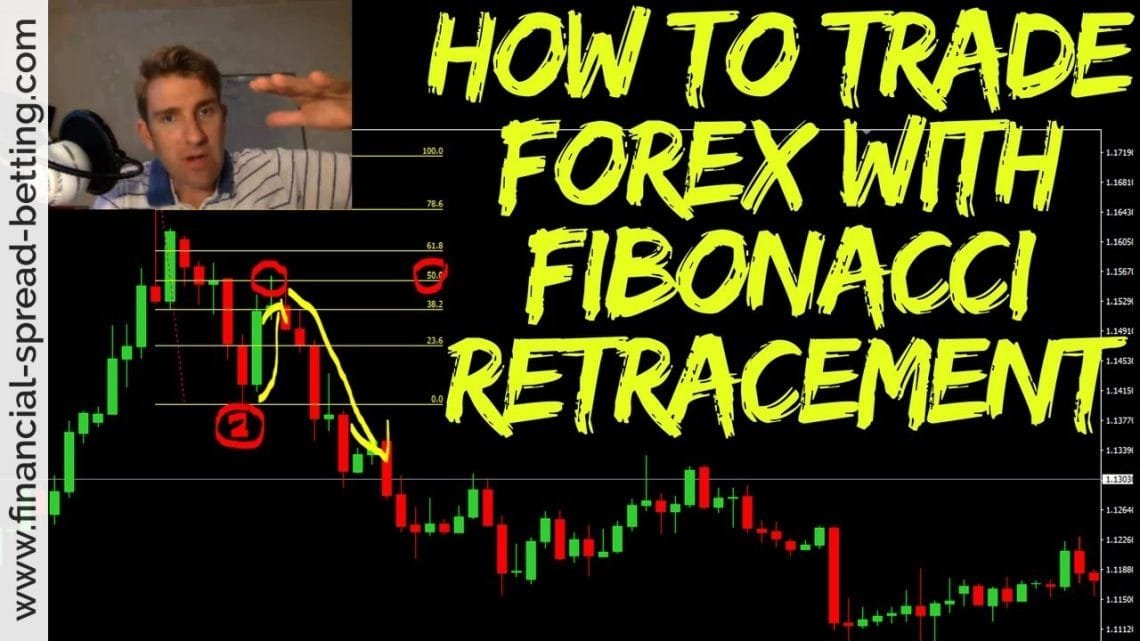
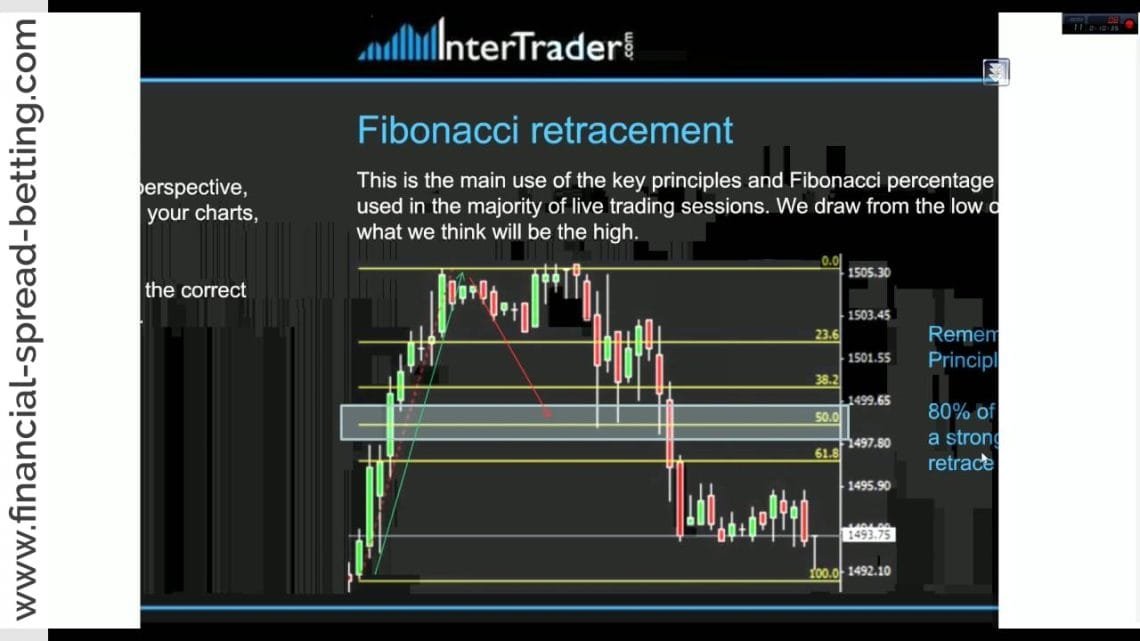
Aside from the direct application of Fibonacci ratios to the wave lengths, you can also determine price goals by using the numbers as percentage retracements. You may remember in module three that I spoke about retracements, and...
Up to now, our review of Elliott Waves has only covered the wave form in itself. But there is more to the Elliott Wave Theory than simply describing the shapes and repetitions of the waves observed in the price. The theory also...
The Rule of Alternation Elliott’s Rule of Alternation has an important message for the chart watcher. He noted that the corrections between rally thrusts tend to alternate between complex shapes and simple shapes...
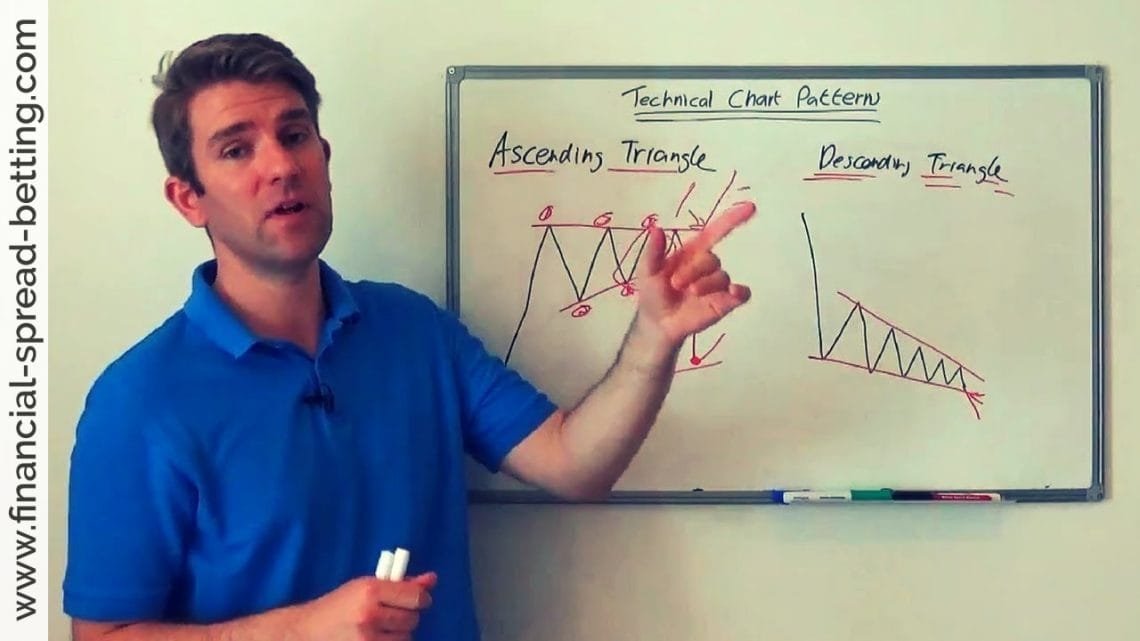
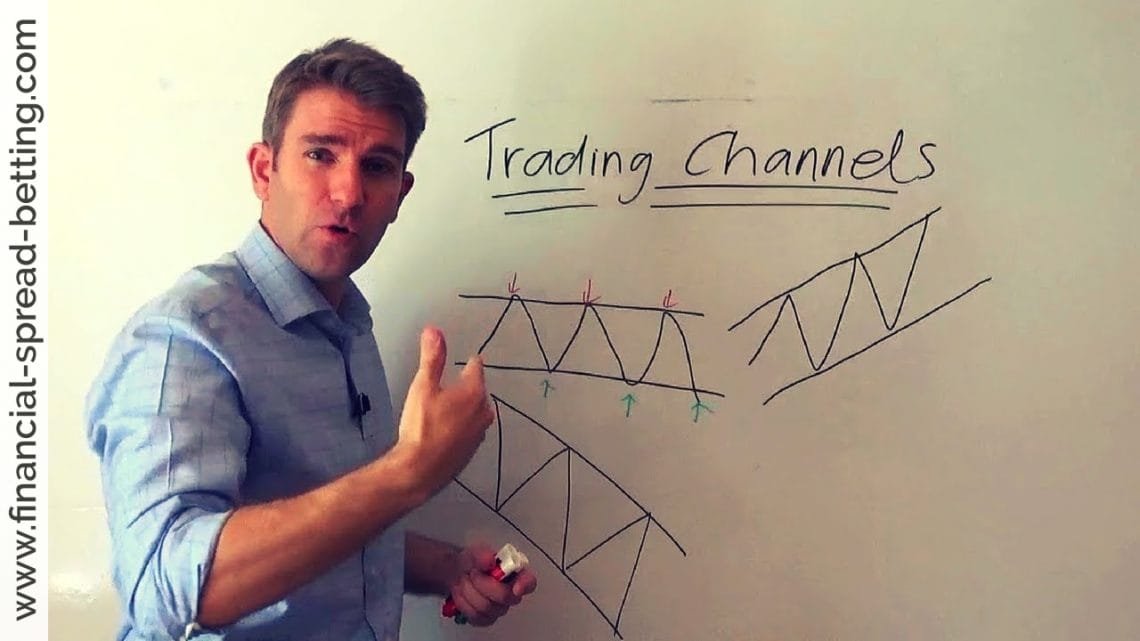
Corrections: Triangles Triangles are the final type of corrective pattern you’ll see. They signify a relative balance between buyers and sellers. You’ll usually find that the triangle forms with lessening volume. They...

Summary I hope that you have been able to see that cloud charting is an enormously useful technique. Rather than just having one indication, the cloud chart allows you to look at the price action from several angles at the same...

I’ve pointed out during the course that technical analysis can be applied to different time frames with good effect. Cloud charts are a particularly good example of this. You can keep the same numbers and just change the...