Actually it’s easier than you think and really the best way to learn is to start trading with small stakes and checking a few charts and the accompanying videos that I have made available for you to watch. On each video I...

Actually it’s easier than you think and really the best way to learn is to start trading with small stakes and checking a few charts and the accompanying videos that I have made available for you to watch. On each video I...
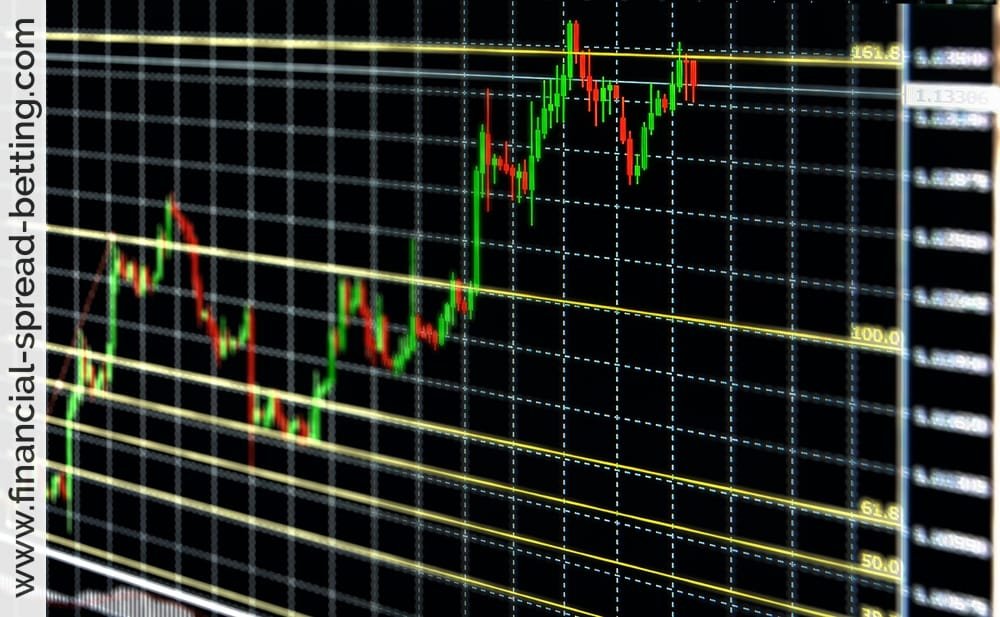
Fibonacci, pronounced fib-o-natchi, Retracements are a mathematical wonder. No one knows exactly why they work, nor indeed thankfully, do you need to know why they do work. The Fibonacci retracement tool is one of several...
Before you begin to open your account, make sure that you understand and have used the system with real prices. Spread betting providers are better than equity and futures brokers at providing free ‘training’ or...

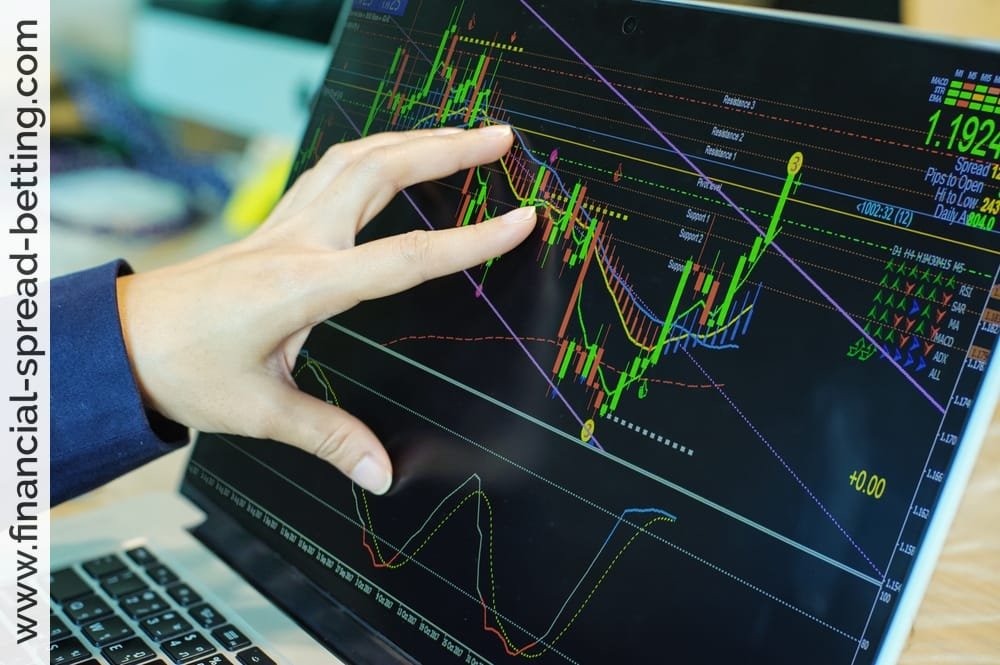
The Technical Analysis chart patterns that I use in order of importance, to me, are as follows: Support & Resistance Triangles Head & Shoulders Bounce/Retrace Support & Resistance Support and Resistance is one of my...
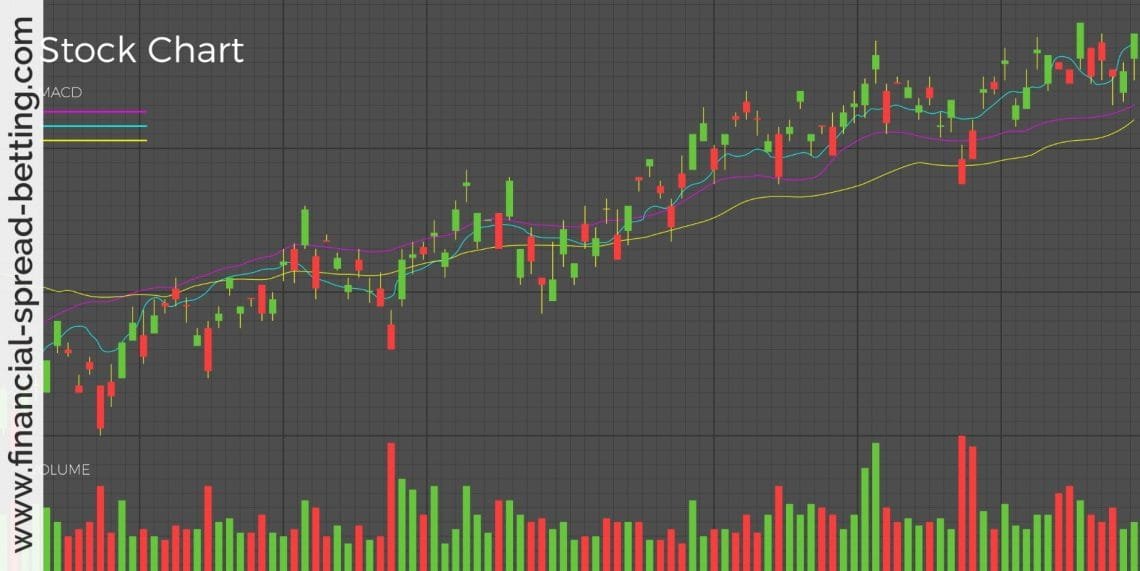
The moving average convergence/divergence technical indicator or MACD as it is commonly known is a charting technique developed by Gerald Appel in the late 1970’s. The technique is utilised to attempt to predict changes in...
The three I use sometimes are: RSI = Relative Strength Index Momentum Accumulation / Distribution Relative Strength Index RSI is one of two Momentum indicators, no prizes for guessing what the other one is. What momentum...
Over the next few pages I aim to cover the key candlesticks that I use to spot price movements. Candlesticks are great for spotting contrary movements within markets that may on the longer term be trending in any given direction...

Candlesticks are becoming more and more popular in the west. They’ve been around a very long time indeed, but it was the fantastic work of Steve Nison that brought Candlesticks as we know them, to the western focus. Up until this...
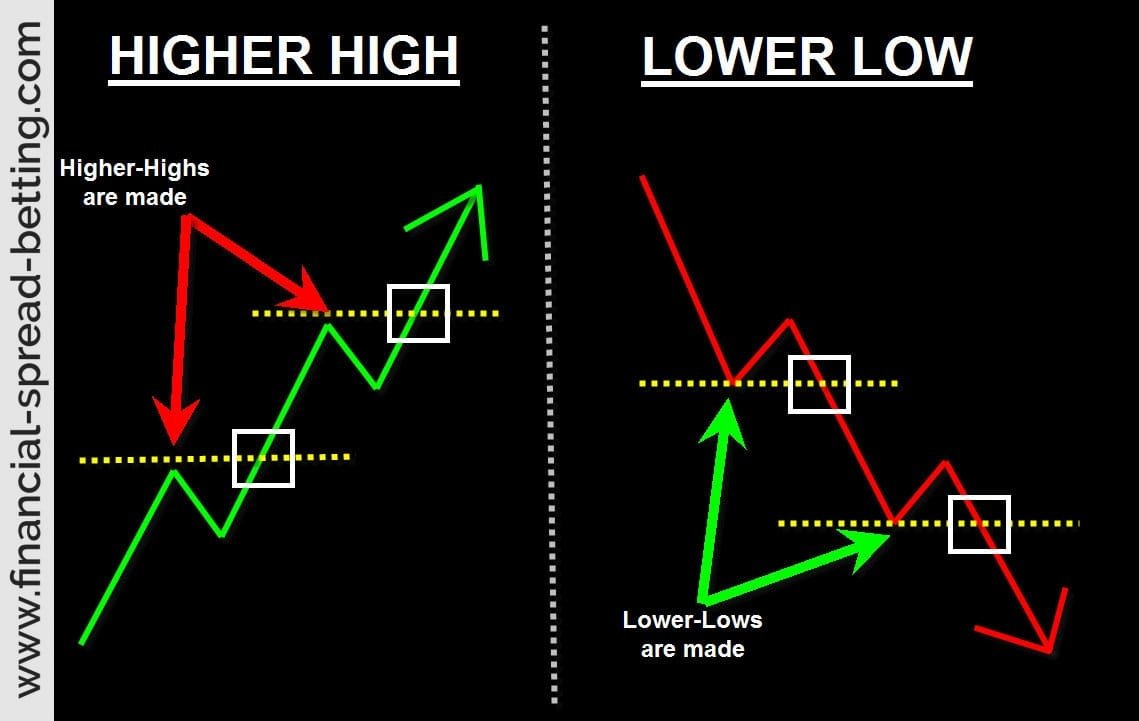
This is really easy to grasp. When there is a higher High, in another words when the price closed higher than the day before, this is a signal of greater confidence and a possible trend for further higher prices. On the flip side...
In order to succeed at trading, you must have an edge. Your edge begins with the knowledge you gain through your research and testing that a particular price pattern or market behavior offers a level of predictability and a risk...