


How To Best Use RSI (Relative Strength Index) The next thing we are going to look at is the RSI...

How To Best Use RSI (Relative Strength Index) The next thing we are going to look at is the RSI...
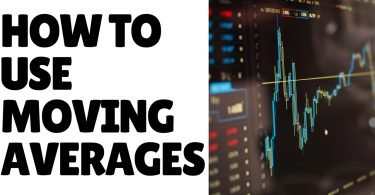
What Is A Moving Average? Understanding Moving Average SettingsSo, a moving average is very, very...

Trading Indicators. The foundation of good trading is understanding the relationship between...

Technical Analysis – looking at the time of day. Why is this important? What can we...

What are key levels? How can we trade from them? Support and resistance levels can be classed as...

What are trendlines? What are Trend Lines and Why are they Important? How do we draw trend lines...

Let’s now look at charting and technical analysis. Next we will look at: Support and...

Practicalities and looking at higher timeframes. When day trading and charting it is best to...

Candlestick Chart Example. This is an example of a candlestick chart – I illustrate...
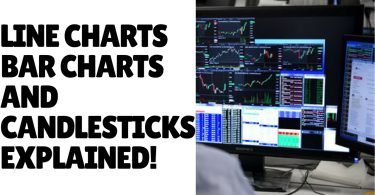
Summary 📊 Line vs. Bar and Candlestick Charts Line charts provide only the closing price, which...

Summary 📈 Introduction to Charting Charts depict price movements of assets over time, aiding in...

Summary 📈 Types of Market Conditions Trending: Upward or downward with predictable pullbacks. Range...