How To Use Moving Averages
Moving averages (MAs) are a very versatile indicator that can make trading a lot easier. Let’s briefly discuss what they are and then have a look at the practical applications of them….
What Price?
So the Simple Moving Average, Weighted Moving Average, Exponential Moving Average and others are the types of moving averages that you have on most charting software, and each can generate a family of lines, calculated for different periods. There are even some trading methods, which I won’t go into here, that require a whole set of averages fanning out on the chart. Most trading uses include only one, two or three constructions of moving averages.
Just before going on to show you how you use moving averages, I must mention that some traders also get concerned with which price is used in the moving average calculations.
With many charting packages, you’ll just have a choice of type of moving average and number of time periods. That already gives you a large range of curves that you can use. Universally, by default the price for each day is the closing price, so that standard is what I have used in this module.
There are some analysts who prefer to use the mid-range value of the trading during the day, which is calculated by summing the high and low values and dividing by two. Some others will add the high, low, and closing prices together and divide by three, averaging them out, to get the price for the day The opening price is dropped because it is less relevant to the day’s values, which are defined by the limit values and the final settled price. And others will calculate moving averages for the high prices and low prices separately and draw two separate moving average lines, which means the difference between them gives some indication of the market volatility.
None of these variations has had much impact in the trading world – don’t you think they’d be more prominent in common trading software if they were dramatically better? – but you might as well know about them in case they crop up in the future. You will probably find more difference between the different types of moving average than between the different basic values used to generate them.
Moving Averages
How to Use Them
There are many different ways to use moving averages in technical analysis. I’ll go through the main ones here, but other ways are being invented all the time. Because of volatility, prices go up and down and each individual price has little meaning in itself. Moving averages provide a way to smooth out these wild undulations and isolate the overall movement of prices.
All moving averages fluctuate less than the prices. The greater number of days you average, the gentler the moving average but also the more the value lags current price action. So selection of the number of days is important and depends what you’re trying to achieve with the average.
You can always experiment with increasing or decreasing the number of days, and different values may work better in different markets. The selection is critical, but with hindsight you could always find the moving average which would have been most profitable – the challenge is to find the moving average which will be consistently profitable in the future. You need to beware of over optimising to historic values at the expense of general good performance in the future.
Note also that moving averages tend to work better for certain markets than others so experimentation and backtesting helps here. It is important to bear in mind moving averages are of little use in a sideways market where they tend to give plenty of false signals.
Uses of Moving Averages
Moving averages help you to identify the direction of the trend. Stock prices can only move three ways – up, down, or sideways. We are only interested in stock prices that are going up for “long trades”, or down for “short trades”.
Note: we are only going to consider “long trades” (a trade where you ride a trend upwards, as opposed to “short trades” where you bet on the price going lower) in this article.
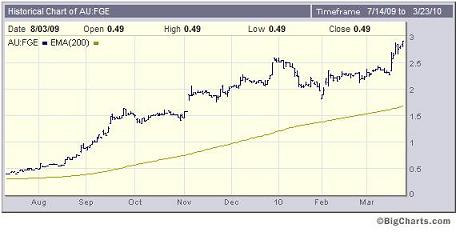
This stock is clearly in a long-term uptrend. The price is sitting nicely above a rising 200-day EMA.
Converting between Weekly and Daily Moving Averages
One trading week is represented by five trading days.
1 week = 5 trading days.
To convert a daily moving average to a weekly moving average you simply divide the daily MA by 5.
i.e. 20-day EMA = 4-week EMA.
To convert a weekly moving average to a daily moving average, multiply the weekly MA by 5.
i.e. 10-week EMA = 50-day EMA.
Summary Points:
- Moving averages make trends obvious
- EMAs (Exponential Moving Averages) display recent price action more clearly than SMAs (Simple Moving Averages)
- Moving averages are lagging indicators – they don’t predict the future
- Moving averages only work in markets where there is a clearly defined trend. They don’t work in ranging markets
- A long-term moving average displays the most important trend
- The two most important attributes displayed by moving averages are trend direction and strength
- Moving averages provide a practical way to analyze a trend. They aren’t the “be all and end all” of trend analysis, but they do provide an excellent foundation for further investigation.