
Although the odds are that you won’t use point-and-figure charts unless your charting package will plot them for you, I will go through the manual process so that you understand what you are looking at.
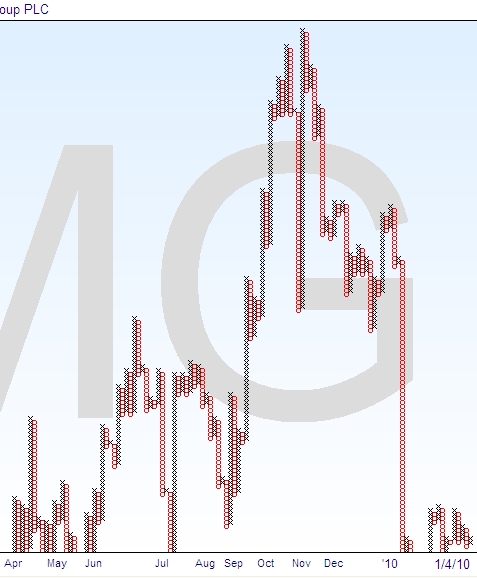
First note that the point-and-figure chart is a series of alternating columns of Xs and Os — the Os are in red on this plot to make them easier to discern. The Xs are drawn on rising prices, and the Os drawn when prices are going down. The actual process used for drawing is quite easy, as you might expect for a system that dates back so far.
The charting process was developed to track stock movement, and was originally used to record each whole point move in the price. If you imagine that the Xs and Os are drawn in little boxes on graph paper, as they would have been originally, then each box vertically would represent one whole point, or a chosen number such as five or ten whole points if the value was high, such as an index.
Now there are three types of point-and-figure chart usually plotted – the 1 box reversal, the 3 box reversal and the 5 box reversal. These just control how many boxes the price has to reverse before you start plotting in the other direction.
So for the sake of example, assume we start plotting in an uptrend. The Xs are used for upward movement, so you would put an X at the current price, and add another X above every time the high price for the day increased by the whole box value. So you would look at the high price for the next day, and add Xs if you need to.
Now the day will come when you can’t add any Xs because the high price isn’t any greater than what you’ve already plotted. The reversal for plotting purposes is when the price moves the designated number of boxes – 1, 3 or 5 – in the opposite direction, so you would check the low price and see whether it signaled a reversal. If not, no problem, just wait to see what the next day brings.
But if it did signal a reversal, by being say at least 3 boxes lower than the last box if you are plotting a three box reversal chart, you would move to the next column, down one box, and draw Os going downward for 3 boxes. Your daily routine now changes, as you must look at the low price for the day to see if you can draw any more boxes downward. You will stay with drawing Os downward as the price declines until the day comes when the low price is no lower than what you have already drawn, and when you check the high price for the day you find it is at least three boxes higher, which means another reversal.
This time you move to the next column, go up one box, and then draw three Xs going upwards. You’re back where you started, drawing an X column upwards for as long as you have higher prices to plot. You can see how if there is not much price action or strong in trend action you can stay on the same column for days.
While you can’t see volume directly, as you do with the bar chart or candlestick chart, the volume is reflected in the number of price changes recorded on the chart because of the way it is drawn.
An interesting fact about the point and figure chart is that it is more flexible than the candlestick chart, at least in one particular way. You can plot point and figure charts to look very different from each other depending on your reversal criteria, for instance using a five box reversal instead of a three box reversal. The larger number of boxes you need to reverse, the less sensitive the chart becomes. Similarly you can vary the chart by changing the box size, i.e. how many points you include in each box. With a larger box size, using say 10 points to a box, then you get fewer signals. You might choose to do this if you found you were getting too many short term signals and trading too much.
If you think that you want to experiment with point and figure charts for your trading, then it is worthwhile playing around with both these elements until you get a chart that gives you the best performance for your purposes.