As you might expect, the descending triangle is the exact reverse of the ascending triangle, and is a bearish pattern whenever it is seen. Usually it will be seen in the context of a downtrend, and therefore it is regarded as a continuation pattern. In a similar way to the ascending triangle, it can sometimes be found in the opposite trend which then makes it act as a reversal pattern.
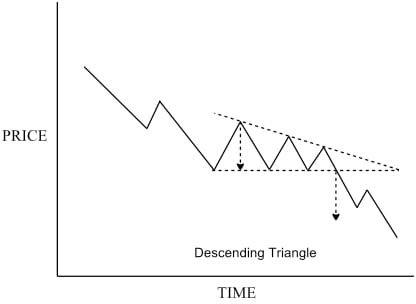
Once again, the simplest way to form a price target is to transpose the height of the pattern on to the point of breakout, as shown with the downward pointing arrows. The breakout must be, at a minimum, signaled by a close below the lower line, and you can apply the other criteria for meaningful penetration if desired.
Descending Triangle
Both the ascending and descending triangle patterns usually take at least a month to resolve. When you see a similar shape over a much shorter timeframe, it may be a pennant or wedge, which I’ll introduce in a moment.

