You are much more likely to see double patterns than triple patterns. It is almost as common as the head and shoulders reversal pattern. Here’s the double top –
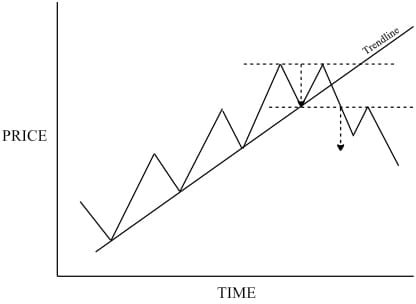
As you can see, the two peaks are at roughly the same level, showing a weakening in the uptrend. After the second peak, the price violates the trendline, which in itself tells us that the trend is changing. At this stage, it could be headed for a lower slope, or for a period of consolidation. But when the price drops below the previous low point, between the two peaks, this completes the pattern and confirms the reversal signal.
Double Top and Double Bottom Reversal Patterns
Because of the shape formed by the two peaks, this is also referred to as an ‘M’ top. Although this only has two peaks, it’s really very similar to the head and shoulders and triple top, and the analysis given before basically applies. This includes the importance of looking at the volume for confirmation that the change in trend is real – lessening volume building up the second peak, and strengthening volume as the price breaks support downward.
The equivalent double bottom is just the same –
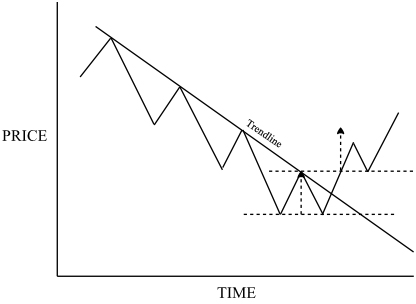
Bottoming Market: Bull Reversals
Except it is referred to a ‘W’ bottom, again for evident reasons. The price needs to rise above the previous peak on strengthening volume for the pattern to be considered valid.
With both double formations, ideally the two peaks or troughs are at very similar heights. If they’re not the same, it’s best if the second peak doesn’t quite reach the level of the first. If it’s the other way round, and the second peak exceeds the first peak, then it raises the question whether the trend is going to continue with just a slight glitch, rather than reversing.
You can look for a price target in the same way as the other reversal patterns, as shown by the arrows on the two diagrams above. Measure the distance off the trendline that the peaks go to, and transpose that to the other side of the trendline to get the target minimum price level. You can usually expect the price to swing as far in the other direction when it has broken through a line as it went in the initial trend direction. Again, you would look for previous support and resistance levels to help you decide on the target price.
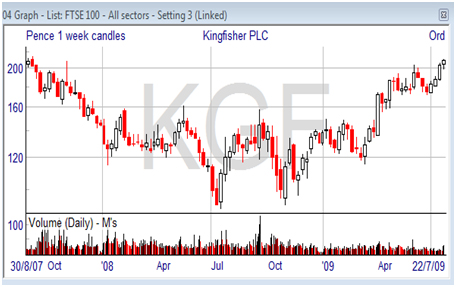
The chart below illustrates a chart of the Japanese Yen against the US dollar. A typical reversal pattern is on display – the bullish ‘double-bottom’. You can see that this exchange rate has twice tried to breach through ¥87 but has bounced off that level every time. By projecting upwards the height of the rally between the two bottoms, you get a price target of ¥103.
To trade this setup, you might place an order to buy should the price break above the red line drawn across the top of the pattern. What you’d be looking for is a decisive move above this level. The price should thrust sharply through the line, not merely peep above it. This should be backed by strong trading volumes.
That line at the top of the chart pattern is a practical benchmark for placing your stop-loss order. How far behind this level you place your stop depends on your trade time horizon and how strong is your view. As for taking profits, one possibility would be to place a limit order in the area of the target derived from the pattern. This would allow you to get out with a profit the moment your target price is hit.

Because the double top and double bottom patterns are so simple, it is easy to label many formations as such, when they’re not really. For instance, as we saw when discussing support and resistance, each peak is a potential resistance level, so there is a tendency for the price to bounce back off it even when there is no reversal in store. Traders can get fooled into thinking it is a double top pattern as soon as the previous peak isn’t exceeded. What you need to do is wait until the previous low is violated with a down move, so that you can see that the market is tending to a reversal. After all, most of the time a trend will continue rather than reverse, so you shouldn’t rush to conclusions on inadequate evidence.
As with the other patterns, the size of the double top and double bottom patterns is significant. As a general rule, the larger pattern, the stronger the potential reversal. Size is measured both as height, giving an idea of the price swing that you can expect, and in width or time period. Most double patterns are a month or more between peaks.