The flag and the pennant are different continuation patterns, but I put them together here as they have the same characteristics and usually are seen in the same context. They can form after a sudden, sharp rise in the stock price accompanied by high volume. A series of profit taking can result in the formation of a tight parallelogram that slants against the prevailing trend. The volume decreases during the formation of this zone and must rise on the breakout to complete the pattern. They are short term patterns, lasting normally one to three weeks, and can be looked on as pauses in a trend.
Flags and Pennants
The Flag
The flag looks like this –
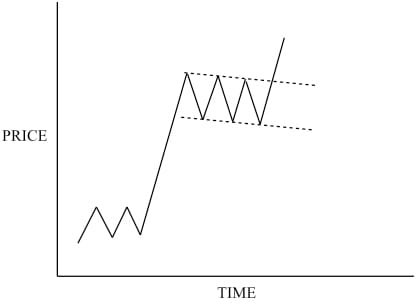
The flag is basically a rectangle, with two parallel trendlines. In the example above the trendlines are defined by three peaks and three low points. It is said that the “flag is flying at half mast”, with the sharp increase in price looking like the flagpole. This implies that the continuation signal will be followed by a price move similar in size to the prior one.
Both the flag and the pennant are seen in a position as shown, where there has been a sharp move in the price. In fact it’s one of the requirements for identifying the flag and pennant that they are preceded by a sharp practically straightline move, as shown above and below. It’s almost as if the price has to catch its breath after the surge before continuing on. The flag can occur in both up and downtrends, and can be expected to slope against the trend – so in a downtrend, it would slope upwards. Perhaps because of the strength of move beforehand, it’s very rare that a flag pattern would let you down and become a reversal. It and the pennant are considered some of the most reliable continuation patterns.
Trading Tip – best traded when tightly built. Flags that form just after a significant trading range breakout can signal the start of major moves or trends.
The Pennant
Here is an example of the pennant formation –
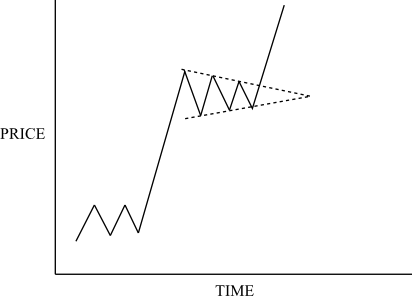
As you can see, this is very similar to the flag. Once again, I have shown it with three points of contact on the trendlines, the preferred number, although this can vary. It looks a bit like the symmetrical triangle, but there are two big differences. First, it comes after a steep rise (or fall) as shown. Second, it is much shorter in duration, at 1 to 3 weeks, whereas the symmetrical triangle may take many weeks to resolve.
Trading Tip – Just like flags, pennants are best traded when they appear as tight formations. The tighter the pennant, the more reliable it is as an indicator of continuation of the price trend.
Both the flag and the pennant will show a big drop off in volume as the pattern develops. You should get a good increase in volume when the price breaks out. When the price breaks out, the pattern is considered completed. Both patterns are expected to be at about the halfway point of the price move, that is you can expect about as much rise after the pattern as occurred in the burst that preceded it.
In summary, both patterns must be preceded by an almost straight line move which is usually associated with heavy volume. In the pattern itself, volume is usually light for one to three weeks, while the trend “catches its breath”. Then the trend will usually resume in the same direction, accompanied by increased volume. These patterns are very common in financial markets.