
Interpretation
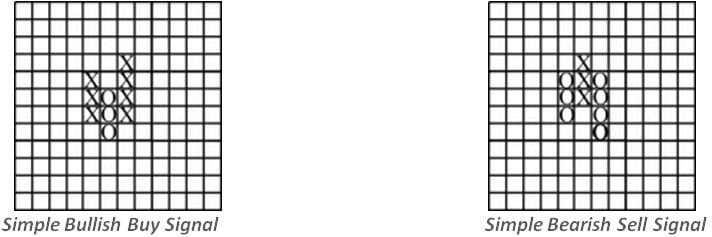
Any time you are drawing a column of Xs, and it moves one box higher than the previous column of Xs, this is a breakout. Similarly, when you are drawing Os and the column goes down one box below the previous column of Os, you have a downside breakout. You can buy and sell on these breakouts, and you can see how unambiguous they are compared with a bar chart. You can set your protective stop below the previous column of Os, for an uptrend, or above the previous column of Xs when you are selling short.
Now you can also use pattern recognition to generate buying and selling signals. In fact the simplest patterns really just put into a diagram the above descriptions of breakouts.
There are more complex patterns available, particularly for the one box reversal style of charting, which tends to see patterns similar to the regular candlestick chart, such as a form of head and shoulders.
Point-and-figure charts can also be used for determining price objectives very easily. The theory is that there is a direct relationship between the width of a congested or sideways area and the size of the move when the breakout occurs. In other words, you take the most congested horizontal line and swing it vertically to get a price target. If you’ve used a 3 box or 5 box reversal, then you have to multiply the price target by three or five.
In case you’re wondering how to choose between the one, three, and five box reversal charts, this depends on the sensitivity you require and the trading period you are looking at. When you use higher numbers there are fewer reversals and it allows you to identify the major trends more easily.
Despite the lack of a consistent time scale, chartists can draw and use trend lines on point-and-figure charts. The difference is that these are drawn at a 45° angle, and they are not expected to connect the tops or lows. To draw a bullish support line under the chart, you simply draw a 45° line upward from the lowest column of Os. Similarly, for a bearish resistance line you would draw at 45° downward from the top of the highest column of Xs. The ShareScope charting software will do this automatically, and here is an example –
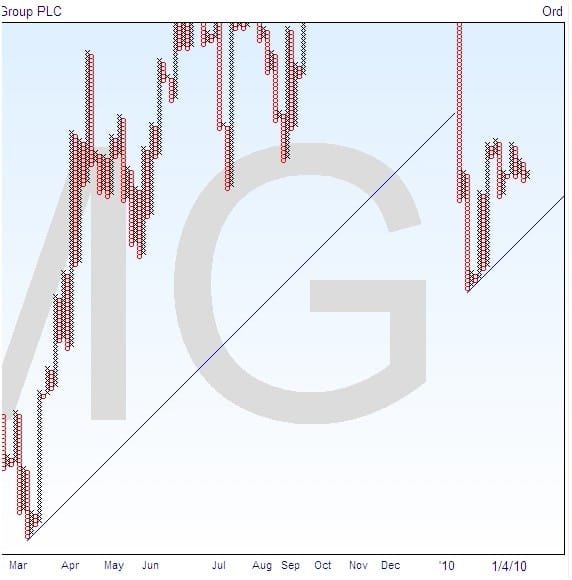
Sometimes with a strong uptrend the price action finishes up a long way away from the trend line, such as in this example, and it would be quite in order to try and draw a tighter trend line from another column of Os.
There are other ways that you can trade on the basis of point-and-figure charts, but they all tend to rely on the idea of a breakout above previous levels, in other words similar to the horizontal support and resistance lines on a bar chart. The advantage with point-and-figure is that the breakout is much more clearly defined, and so easier to trade.
Point-and-figure makes it easy to use a trailing stop on a continuing move. All you have to do is keep adjusting your stop to the latest previous column. For instance in an uptrend your protective stop should be just below the last column of Os, and as the chart progresses you keep moving it. This allows you to keep in the position and protect the profits you have made.