
Module 13 – The Stock Market
Introduction
With the knowledge of technical analysis you now have, it’s time to look at the different things you can trade, and see how it works in each particular market. Before we get into discussing the more intricate details of derivatives, we’ll look first at the stock market, which still accounts for a significant amount of trading.
The stock market, or stock markets, as there are one or more in many countries, are divided into market sectors which are then split into industry groups. If you research the various divisions, you will see some intermarket effects, and usually be able to find a good area in which to trade. For instance, you will find that gold mining shares are closely linked to the price of gold, and in fact may be a leading indicator for gold prices. Rising energy prices, particularly the price of oil, will obviously help energy shares, but it’s likely that airline stocks will fall. If there is a strong dollar, small-cap stocks may do better than larger stocks, as the larger companies tend to be multinational and a strong dollar makes their goods more expensive in the international market. Not all intermarket relationships are so logical, and you will be surprised at what you can find or deduce.
Relative Strength Analysis
Not to be confused with the Relative Strength Indicator (RSI), relative strength analysis is simply dividing one market element by another. If this number is increasing, the one you divided it into is stronger; if this number is decreasing, the one you divided by is stronger. You can use this to compare a market sector to the economy in general, or you can pick a company and compare it to the sector’s performance.
Here’s a comparison of the Dow Jones Pharmaceutical Index to the DJIA.
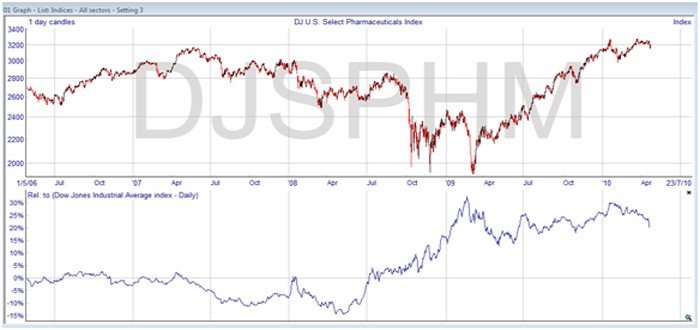
You can see that even though the index itself is climbing through most of 2009, it’s only doing slightly better than the total average, as how it is doing relative to the DJIA is shown on the lower chart. Prior to that, in the second half of 2008, it was actually outperforming the market, even though looking at the index alone the performance was not good. Of course, this was a particularly traumatic time for the financial markets.
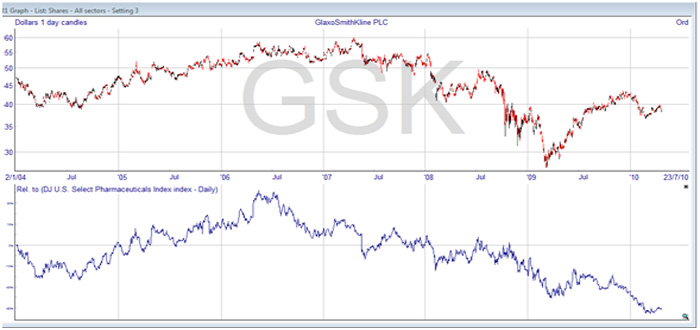
Drilling down further, this chart shows the performance of Glaxo Smith Kline, the pharmaceutical company, on the top chart, and related to the pharmaceuticals index on the lower chart. You can see that GSK was apparently performing well through most of 2009, but glancing at the lower chart, it’s plain that it was one of the weaker stocks in its sector, particularly towards the end of the year.
How can you use this in your trading? Depending whether you are going to trade on indices or on individual stocks, you can start at the highest level, comparing a sector index to the overall markets, as represented by the Dow Jones Industrial Average, S&P 500, FTSE All Share, or whatever seems most appropriate. You can then see how the sector is performing, even applying simple tools like trend lines and moving averages to help you spot important changes in the trend.
With this information, you can see which market sectors are outperforming or underperforming the overall markets. If you plan to take a long position, it would be better to be in a well performing sector. You could stop there, choosing a composite index or exchange traded fund and trading on the uptrend. The idea would be to invest in the sectors that are turning up, and to move out of the market sectors where the relative strength lines are turning down.
But as this module is about stock market trading, you should consider the next step, which is to perform a relative strength analysis between individual stocks in the sector and the sector index. By doing this, it’s easy to see which stocks have the greatest relative strength. These are exhibiting a strong uptrend, by being the strongest performers within a strongly performing sector, and therefore they are prime candidates for a trend following trading plan. Another way to use this information is to go for a cheaper stock where the relative strength index is just turning up, in anticipation that it will continue to improve. You should avoid stocks where the relative strength index is going down.
This procedure is called a top-down approach to the markets. You start at the very top, looking at the overall market, and you work your way down to individual stocks, so that you pick the best stocks in the best sectors. It’s a tried and tested way of being sure you are on the right side of the market. There is another way to assess the overall health of the market, and that is by looking at market breadth.
Firstly thank you so much for the time and effort you’re put into creating this website! I’ve been studying it now for the past few months and am greatly appreciative!
I’m just trying to pool everything together now and starting to formulate a trading strategy etc. However I’m confused as to how to perform the Relative Strength Analysis for Shares
What program/website allows me to do this, any suggestions?
Also regarding the ‘Trading Strategy: Buy Relative Strength’ How do I work out if the performance of a share is better than the market by at least 10%, and better than the sector by at least 1% over the past week or two?
I’ve tried looking at websites to see the % growth of shares, sectors, but this seems to be either for one day or a month.
Please could you point me in the right direction regarding how to and what resources to use in order to effectively carry out the top down approach for picking trending shares.
Many thanks again!
Rob