
Targeting the Price
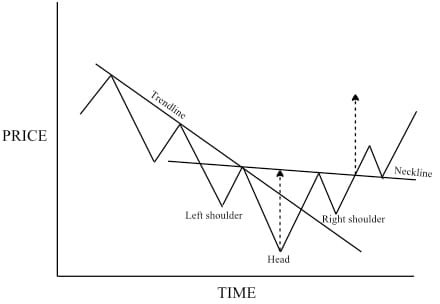
Part of trading profitably is to work out the risk and potential reward of every trade that you make. Some trades just don’t offer enough upside to make the risk worth taking. So you need to know about ways to figure the price move you can expect, if all goes well. The dotted lines on the chart above give a simple way of figuring a price target, and this is the minimum that you can hope for with a trade that goes right – often a trend will keep on going, but the minimum target tells you at the outset if the rewards are favorable. The maximum that you can look forward to is just the same as the previous up move, as you can only expect reversals to retrace what just happened.
There are other ways to look at the expected target level, and you should consider them all when trading. Another way similar to but simpler than projecting the dotted line length down, as shown, is to look at the distance retraced from the head peak, and just double it downwards. This would only be different by the amount of neckline slope. In principle, the price target is as far below the trendline as the peak was above it, and this applies to most reversals. The vertical size of the pattern directly affects the size of the reversal expected.
Theory: Head and Shoulders Reversal
Considering the price target shouldn’t just stop there. There can be other factors involved in the size of the reversal. For instance, there may be prior support and resistance levels that you need to look at. If your price target is close to a previous support level, probably the support will be a more accurate objective.
You may also want to consider the 33%, 50% and 67% retracement levels for the current uptrend. These can all influence the stopping point for the downtrend. If several of these coincide, that gives a more powerful indication of a significant level for the stock price. You will learn to assimilate all these different factors to improve your anticipation and hence your trading.
Inverse Head and Shoulders
The inverse head and shoulders occurs when a downtrend reverses into an uptrend, and is basically the head and shoulders pattern we have just analyzed turned upside down. As such, it’s really just a gradual change in the direction of the trend, marked by a penetrated trendline and weakening of the current trend.
Again, there are three points to the pattern, with the middle one, the head, being lower than the shoulders. The neckline is drawn across the two peaks between the low points, and it’s necessary for the price to rise clear of the neckline, otherwise it could just be a consolidation or sideways trend. The neckline is quite likely to slant downward, but does not have to for the pattern to be valid. If it slopes upward, then you will have to wait a little longer for it to be broken and to enter a long position, but it does indicate greater strength in the market.
Reversal Patterns: Bars, Head and Shoulders Reversal
You can set minimum price targets in a similar way to the head and shoulders topping pattern, looking for the price to exceed the neckline at least as far as it was below at the head. Again you should review previous support and resistance levels to see what other levels may apply.
The volume of trading is important in validating the pattern as an effective inverse head and shoulders. While the volume during downward price moves is not considered that important, you definitely want substantial volume when the price is moving up in a strengthening trend. The volume should increase rising up from the head, and perhaps be even stronger when the price breaks through the neckline. The final bull move must also show significant volume strength to confirm the power of the price’s new direction.
Volume is more important with this pattern than with the head and shoulders topping pattern. Generally, when the price is going down you don’t have to worry so much about volume, as the price can go down without much market action, but just from a lack of interest or demand. When prices are going up, the volume must be strong in order to make the price rise, and it shows that buyers are pushing it up. In other words, it’s a real and supported move.


The Complex Head and Shoulders
Of course, everything is not straightforward, particularly in the trading world, and you won’t always get a perfect copybook head and shoulders pattern. One variation that you can find is called the ‘Complex Head and Shoulders Pattern’, and this is a more complicated version which includes extra parts. The extra parts include a double head or double shoulder – basically the trend is taking longer to turn from one direction to the other. This pattern has the same forecasting ability as the normal pattern, and you can run through the same principles to see why. This is not a very common occurrence.
The Failed Head and Shoulders
Even if the head and shoulders pattern goes ahead as described, with a decisive break through the neckline, it is possible for it to subsequently ‘fail’, that is, not follow through with a change of trend. The first indication that you will get of this is that the price may go back over the neckline – this should not happen once the neckline is broken, and is a sign that the trend reversal is not as solid as it might be. Sometimes the original trend will resume.
This goes back to what I said at the beginning of this module. Don’t look for precision in reading the signs given by technical analysis – it will drive you crazy. Make sure that you understand enough to know what the signs mean on the balance of probabilities, trade accordingly, and don’t lose sleep over trades that go the wrong way. The way to deal with those is to make sure that you close the trade as soon as you can see it is not working out. From what you are learning, you will be able to recognize the signs and cut your losses quickly if need be.
Head and Shoulders Consolidation
I’ll talk about it later in this module, but the head and shoulders can also be a consolidation pattern, and not a reversal. The head and shoulders is the best known reversal pattern, so it’s rare that it will turn up as a consolidation, but this is another example of a failure of the pattern to give the correct signal.
Market Tactics
Because the head and shoulders is so widely known, you may find that other traders beat you to the punch in trading the reversal, and you lose some of the move. For this reason, you may find traders that don’t wait for the confirmation of the pattern before they enter the trade.
For instance, some will anticipate the completion while the right shoulder is still in formation, and start entering some trades. Some may even try to jump on the reversal at the right shoulder to maximize their gains. These tactics may work out, and if you make sure that the volume reinforces the pattern you will have the best chance of success. You risk that the pattern will not go-ahead as expected, so this is a possibility that you must consider in deciding when to trade. A less risky way of making this trade might be to put on half of your planned outlay at the first sign, and add the rest after the pattern is validated.