
Kagi
Another charting variation, and the last to be explained in this module, is the Kagi chart. This originates from Japan, and is believed to have been used at the start of the Japanese stock market, in the 1870s. Steve Nison, who introduced candlestick charting to the West, discovered Kagi and brought it to the attention of the Western trader in a book he published in 1994. Again, it is a system where the time scale is not regularly spaced, and the plotting depends on price action.
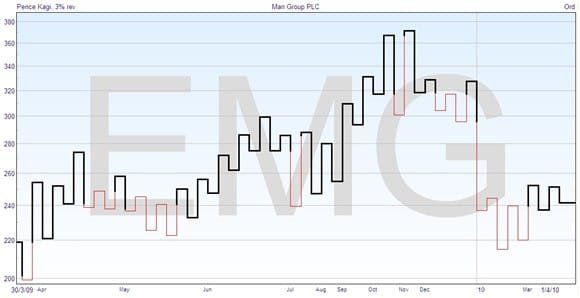
Kagi uses lines of two different thicknesses instead of rectangles to show the price movements, and some charting software will also permit plotting in two colors, as shown above. Once more, it uses only closing prices and deals with price lumps, meaning the price has to move a certain distance before you take any action with the chart. Therefore it requires a trend to be effective.
The first step is to decide on a minimum size of price movement to cause a reversal. It may be an absolute value, or it may be a percentage. The chart above is based on 3%, which is a typical value. If the value is too small, then there will be frequent changes in trend direction that can result in over trading, and if the value is too large you may miss too much at the start of a move. A thick line is normally drawn for an uptrending market, and a thinner line for downtrends. The horizontal connectors are called ‘inflection lines’.To draw the chart, assuming for initial reference an existing uptrend, you would draw a vertical thick line which stopped at the incremental amount — if you had chosen five dollars as the increment, and the price was $152, you would stop drawing at $150. As long as the closing price doesn’t vary by the incremental value on the following days, you wouldn’t draw any more. When the price rises by more than the value, then you continue the thick line upwards. If the price goes down by the incremental value or more, you would draw a horizontal connector and then a vertical line down to the rounded value. You continue drawing the higher highs and the higher lows of the uptrend in this manner, all in the thick line which indicates the trend.
The thin line starts when a reversal goes lower than the previous low point, as you can see in the chart above. The thin line continues, indicating a downtrend, and plotting the ups and downs of the price movement when the incremental value is exceeded, until reversed to an uptrend again by a new value which is higher than the previous high. The system of drawing the chart is mechanical, and the only decision you have to make is how large an increment to use. The buy and sell signals are at the points where the line changes thickness. If the line keeps changing its thickness, then the market is not trending and not suitable for this method.
Kagi charting can be used alongside other conventional techniques, such as candlestick charting. The Kagi chart is good at showing the underlying market movements, and the value can be adjusted easily to avoid false swings. The candlestick chart can be used to time the entry to the trade.
Ichimoku
Recently, a new Japanese trading technique has been catching on in the Western world. It is called the Ichimoku Technique, though many people refer to it as Cloud Charting, as one of the indicator elements has the name ‘Kumo’, meaning cloud. It promises to be powerful and easy-to-use. Because it is arousing so much interest, and is so new, this technique will be covered in detail in Module 10.
At the end of each module there is a quiz. You can take a quiz at any point, but we suggest you view each module before taking the quiz. When you’re ready to start the quiz, click the take quiz ‘Start’ button below -:
The Masters Certificate in Technical Analysis - Module 8
Congratulations - you have completed The Masters Certificate in Technical Analysis - Module 8.
You scored %%SCORE%% out of %%TOTAL%%.
Your performance has been rated as %%RATING%%