
I’ve said it before but it bears repeating. Most of the time we want to trade with the trend to minimize our risk. First and foremost, you need to analyze the chart and identify the basic trend. Only once you have formed a picture of the way the security is trading should you look at the indications given by an oscillator.
So what can you expect an oscillator to do? I’ll discuss it as we go through, but most of the time it gives us an early warning of a potential change. Sometimes the oscillator can be misleading, typically as moves are starting up. But with an established move the oscillator can be valuable in signaling when it is coming to an end.
Now I’ve said that most oscillators look roughly the same. They’re plotted along the bottom of the chart and have one or more lines. The lines are around the middle when the price is trending or going sideways, but if the price has a peak or a low point, then the oscillator will show the same. Usually there’s a middle line and often upper and lower boundary lines. The vertical scales vary, sometimes the middle is called zero, but it’s the way the line moves that is important.
I’ve added four oscillators (the charting software limit) to the share chart that we’ve been looking at so you can compare them. Just to repeat, you wouldn’t normally use that many when you are trading. Here’s the chart –
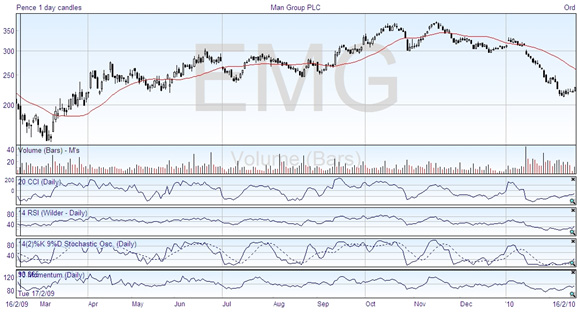
The oscillators shown are momentum (along the bottom) and then from top to bottom the Commodity Channel Index (CCI), the Relative Strength Index (RSI), and the Stochastic Oscillator. I will explain how each of these is formed. You can see that the ups and downs roughly echo the pricing movements.
The first thing to look at is when the oscillators are at the extremes of high or low. As mentioned above, this means a correction may be due. The extreme highs in April were followed by a slight correction and sideways trending, the highs in June led to a late June decline, July again had a peak that was followed by a price reduction, and you can see for yourself how this pattern continues. On the low side, May and the beginning of July were followed by uptrends. Notice that the over extension of the oscillators typically precedes any price action.
In general, when an oscillator is in the lower half of its range, perhaps coming up from an over extended area, then you would expect to be buying or going long; if the oscillator is in the upper half then you probably should be trading short. The crossing of the centre line is also considered an important sign, and can be used for buying and selling signals.
Another point with oscillators is that if the direction diverges from the price trend, this should be taken as a warning signal. Look at mid-October. The oscillators all start coming down while the price is still rising. Sure enough, a couple of weeks later the uptrend fails and the price declines.