
The Market Discounts Everything
It is generally recognized that there are three basic principles or tenets that underlie technical analysis. The first is that the action of the market reflects everything there is to know about the price. This is extremely important, because underpinning technical analysis is the concept that just by studying market action we can get a good idea of future movements.
Technical Analysis Explained
There are many things that can affect the price. These include fundamental factors, such as how well products are selling and what profit margin can be achieved; political or corporate factors, such as legislation, the installation of a new CEO or changes in working practices; and psychological factors, such as whether the latest toy will become a teenage fad, or the Blackberry becomes a must-have for business reasons. By cutting across this, and declaring that all these factors which may or may not be knowable become included in the price by market action, the technical analyst can focus on the market alone, and doesn’t need a squad of research assistants.
In case it seems that this is oversimplifying the situation, consider that all it really means is that supply and demand is demonstrated in market action. Classic economics teaches us that supply and demand set the price – if demand exceeds supply, then in time the price will rise, also known as a bullish market. On the other hand, a surfeit of supply and little demand will inevitably lead to a falling price, or a bearish move. What causes supply to increase or reduce need not concern the technical analyst; the same with demand. The result is all that matters.
If you think about it, this makes our task a lot easier. If we can rely on just looking at the price and volume (and we can) to give us information on the effects of all these different influences, then we reduce the whole problem that we might have had down to a manageable size. In fact, it’s rather neat the way it works out, since many of those factors that affect the price would probably be hard to quantify.
By tapping into what market action tells us about a stock or security price, we are letting the market tell us in which direction it will go, rather than trying to second-guess the buyers and sellers. While there are certainly reasons that the prices go up and down, it is just not necessary to know those reasons when making a prediction of future movement.
It’s an important principle of trading that you let the market tell you where it is going. Some people seem to think that they can control the market, or at least tell it where it ‘should’ go, based on all sorts of common sense ideas. If you set yourself up to fight the market in this way, you’re bound to lose in the end as the market is bigger than any single participant. You have to learn to anticipate and go with the flow.
The Market Exhibits Trends
The second tenet of technical analysis is that prices tend to move in trends. By this we mean that if the price is rising, it will in all likelihood continue to rise; when falling, it will keep going down; and when hovering at about the same level, it will keep doing that, sometimes known as moving sideways. Of course, none of these things goes on forever, but it is generally expected that a trend will go on for a while before changing. A lot of trading plans are based on this premise—you may have heard the expression ‘let the trend be your friend’, which means you should trade to follow the existing trend. Whilst doing otherwise is possible, it exposes you to more risk.
We start getting into charting and the different types of chart in the next module, but just to illustrate a ‘trend’ here is a simple chart. You may well be familiar with charts if you have been considering trading. If not, then you must understand that they are one of the core tools available to the trader. You need to learn everything you can about them.
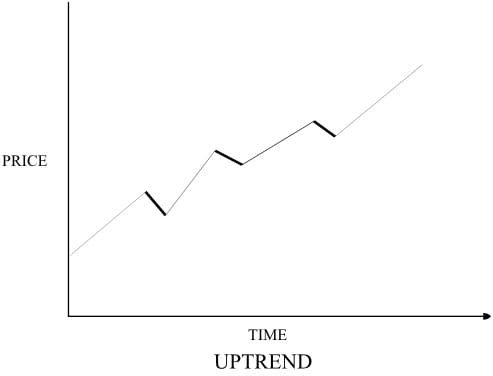
Most charts you will use have the same basic layout. The time is along the horizontal, or X-axis, and the price is in the vertical or Y-axis. The time may show minutes or hours during the day, or days, weeks, or months. You will commonly see charts with the time scale marked in days, and it is the custom to only include working days, five days a week.
This chart shows an uptrend, with the price rising over time. Notice that it usually does not go straight up, but goes up in a series of spurts, with what are called ‘retracements’ in between. This chart shows a fairly clear uptrend overall. Sometimes it helps to look at different time scales so you can identify which way the trend is going – for instance, if you looked at a chart of the same stock as shown above, but with a different timescale that only showed you a retracement, you might think the stock was in a downtrend.
When trading with the trend, your task reduces to identifying the trend as soon as possible, so that you can enter the trade early, and staying with it until it shows signs of failing, or reversing. Unless you are psychic, you probably shouldn’t expect to get into a trade at the beginning of a trend and exit it at the end. That doesn’t really matter. You just need to capture the greatest gain you can, while being confident enough that what you have identified is a real trend. All this is dealt with in much greater detail in Module 3.
History Repeats Itself
The third tenet is merely a statement that we don’t expect people to change their behavior. In other words, we rely on history repeating itself, with patterns and actions that have happened in the past leading to the same results when they happen in the future. Georg Hegel once said cynically that ‘We learn from history that we do not learn from history. ‘ The task of the technical analyst is to learn what history has to teach. The psychology of traders and investors has not changed over decades, and this fact can be used to advantage in technical analysis.
This again is a central belief to trading using technical analysis. We rely on a study of history to tell us what normally happens in a certain set of circumstances, and then we expect that the same thing will happen again. The outcomes are seldom or never sure, but trading is a percentage game. We stack the odds in our favour, and then use shrewd money management to make sure that the end result is a decent profit. No one should expect to win all the time, and in a later module about money management we cover how to keep your losses small.