Reversal Patterns
Candlestick patterns are very useful for spotting reversals but for the setup to mean anything there has to be a trend that is weakening. A reversal pattern is made of one or more candlesticks that often indicate a reversal in the trend. Three general points to note at the start -:
- the pattern on its own is not enough to justify trading, the chart should be analyzed and showing a likelihood of reversal,
- for there to be a reversal, the charts must be showing an established trend, and
- most reversal patterns are specific to either a bullish or a bearish trend, so you must make sure that the reversal pattern applies to the current chart.
The simplest patterns are simply single candles. The Doji candles are noted for showing indecision. The Doji with long shadows both up and down is called the Long-Legged Doji, and really exemplifies the idea. There is evidence that both buyers and sellers have at some time pushed the price, but neither has taken control.
The Dragonfly Doji, as mentioned above, has the open and close at the top. It may be seen in an uptrend or a downtrend, and is often regarded as bullish. I said above that a Doji in a downtrend may not be significant for a reversal, but just a resting place. The Dragonfly Doji is an exception, as it will often represent a reversal in a downtrend.
The Gravestone Doji, with the open and close at the bottom, can again signal a reversal in either an uptrend or a downtrend, but has a bearish bias. This is because the price has ranged up during the day, but the bulls couldn’t keep it there until the close. So the strongest indication of a reversal by this candlestick is when you see it in an uptrend.
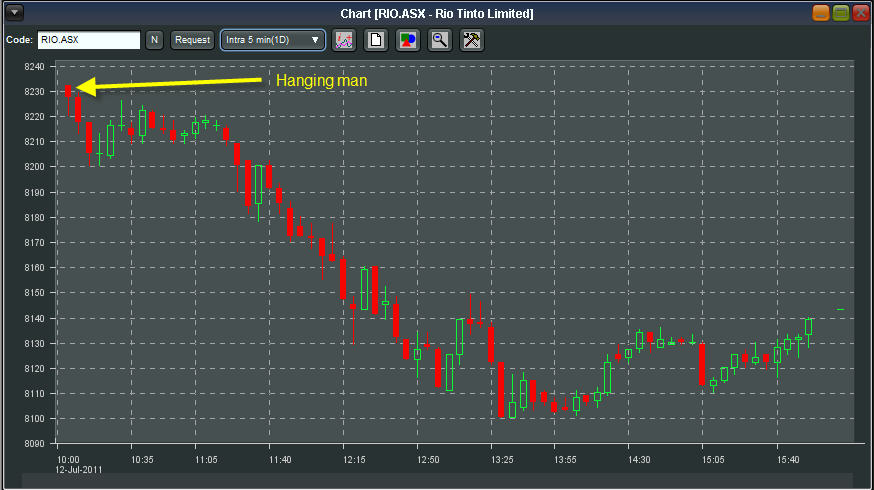
Next to the Doji, the most significant single candle patterns are the Hammer and Hanging Man. It’s easy to confuse these, as they look the same. They are a short real body with no or little upper shadow but a long lower shadow. The difference is that the Hammer comes at the end of a downtrend, and the Hanging Man occurs in an uptrend –
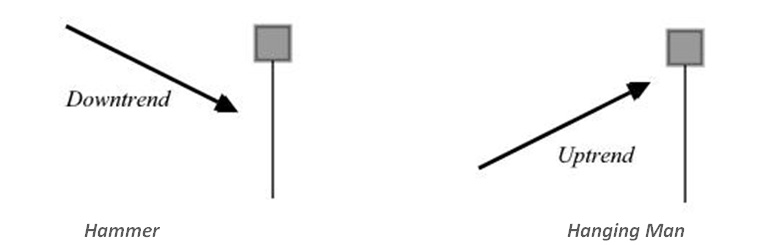
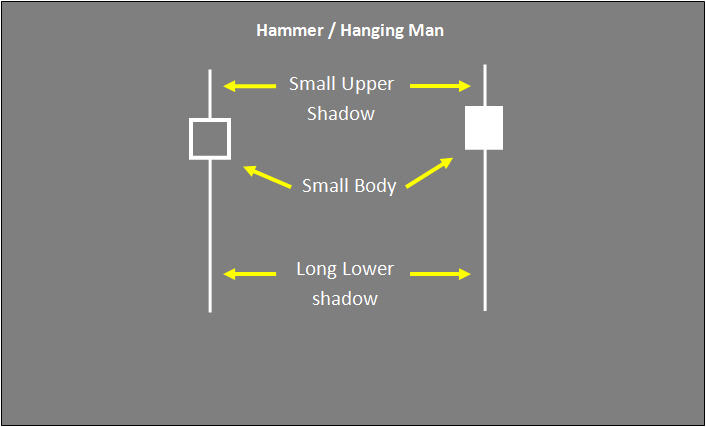
The color of the body is not significant, so I have shown it grey. The lower shadow should be at least two or three times the length of the body, and the signal is stronger the longer it is, and the shorter the body. You can see they’re really just an extension of the Dragonfly Doji idea. The saying with the Hammer is that it is ‘hammering out a bottom’ on the chart.
Note: Hanging Man / Hammer are very similar to spinning tops but as you can see the small body lies at the top of the candle with a small upper shadow and a much longer lower shadow. Sometimes there may not be an upper shadow. When you see that at the bottom of a downward trend it is called a hammer and generally denotes a potential change in the direction of trend. On the opposite end if you find a candle like this at the top of an upward trend it’s called a hanging man and will signal a potential change in trend again.
The complementary candles to these two are called the Shooting Star and, rather unimaginatively, the Inverted Hammer. These are again the same in appearance, and seen in an uptrend and a downtrend, respectively –
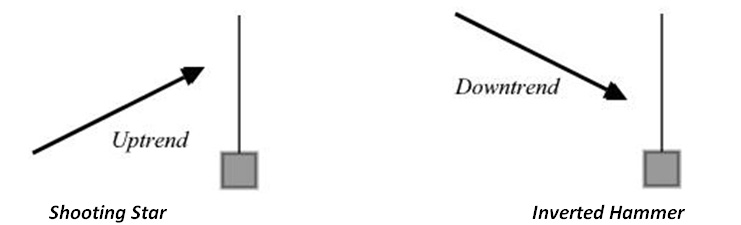
When the Shooting Star comes after a candle with a long body, it gives a stronger signal because it shows that the market can’t sustain high levels. It’s even better if the market gaps up to the Shooting Star. It looks like the bulls are in complete control, but during the day profit taking brings the closing price down.
The Inverted Hammer doesn’t even look like a bullish signal. During the day the market traded higher, but it looks like the bulls failed to sustain the rally. One explanation is that, in a downtrend, the stock may well be oversold. Anyone still holding a long position, probably at a loss, will quickly dump their shares when they see the price increase during the day, which will drive the close back down. Those with short positions may well start to cover, having made their profit. With this candle, watch the next day’s trading closely, as a strong day of trading supports the idea of the reversal.
The last two single candle reversals I’ll discuss are the Bullish and Bearish Belt Hold. Actually Steve Nison, who brought candlesticks to the West, coined the name Belt Hold. The Japanese name is yorikiri, which means ‘push out’. These are long day candles that gap open in trend, but then spend the rest of the day coming back –
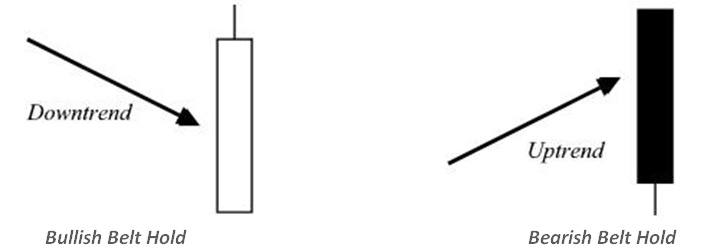
With the Bullish Belt Hold, the market opens at the lowest price the day, gapping below previous candles, but the price immediately starts rising, causing shorts to cover and the price to increase further. The long body emphasizes the bullish tendency, as opposed to the Inverted Hammer, which with a shorter body just suggests a reversal because of the evident indecision.
The Bearish Belt Hold works in the opposite way. In an uptrend the market gaps higher at the start but the price only falls. This makes traders rush to unload their shares, which serves to create the bearish move that they were fearing.
Moving on to candle patterns with two candles, the most important are the ‘engulfing’ patterns; in particular the Bullish and Bearish Engulfing patterns. In these, the second candle runs counter trend and is long enough to totally engulf at least the body of the previous candle. It’s like the Pac Man of candles, eating up the previous trend. The signal is made stronger by the size of the candle and by the volume on that day. Here are the patterns —
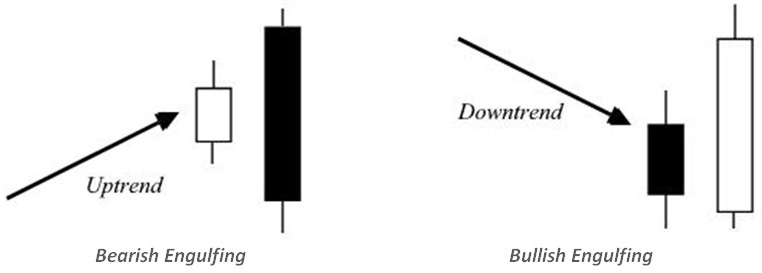
A Bullish Engulfing pattern is made up of two candlesticks, the first being a decline and the second an increase. The body of the second candlestick has to totally engulf the body of the first. This is a clue that selling pressure has persisted after the initial decline with the consequence that the market has opened below its previous closing level. Buyers then came in and lifted the market above its previous open for a strong ending and potential reversal (signal to go long at the open of the next candle).
A Bearish Engulfing pattern is also made up of two candlesticks but in this case a rise is followed by a decrease. Again, the body of the second candlestick has to engulf the body of the first candlestick. This means that after the initial rise there was some remaining buying which caused the share to open at a higher price than its last close. Sellers then took the reign to push prices down below its previous period’s open.
Note that is not necessary for the engulfing candle to surround the shadows of the previous candlestick. If the previous candlestick is short, it emphasizes how the trend is starting to fail, and makes a reversal more likely. Bullish and Bearish Engulfing setups don’t happen often so they should be considered important signals although they shouldn’t be used in isolation (better used with other indicators like the relative strength index (RSI) which would confirm that the market may be overbought or oversold).
You can see a similar idea with the dark cloud cover and the piercing candle, shown below. They are not quite as strong an indication as the engulfing patterns, but they do provide a strong warning that a reversal may be imminent.
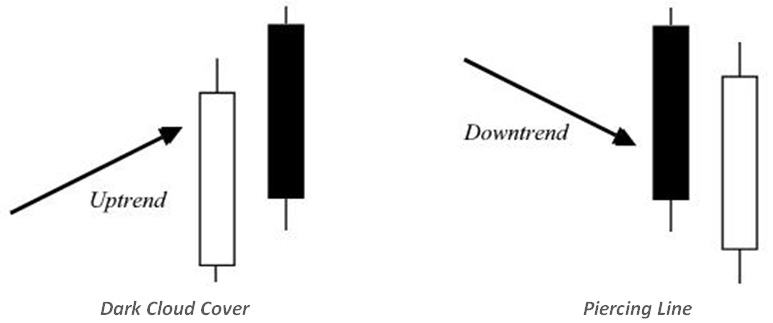
A Dark Cloud Cover pattern happens at market top. On the Dark Cloud Cover, the price should gap above the upper shadow of the previous day. That means the top of the black real body is above the shadow by between 60% and 90%. So at the opening bell it looks like there’s a strong bullish trend. However, during the day the bears take over and the close is at least half way down the previous white body. The further down it is, the stronger the signal, and again a larger volume implies strength. Where there happens to be prior uptrend in place this can often signal a bearish reversal.
The Piercing Line is a reversal pattern made up of two candles where on the first day the market experiences a wide range and then ends up closing near the bottom with the sellers firmly in control. The next day also sees the market trading on a wide range that closes at least 60% of the way into the previous candle. For the Piercing Line, ideally the open should be gapped entirely below the previous day, but with this pattern sometimes it overlaps the shadow. Again you are looking for the close to come at least half way back along the previous real body (this can be a signal of a powerful bullish reversal of a downtrend).
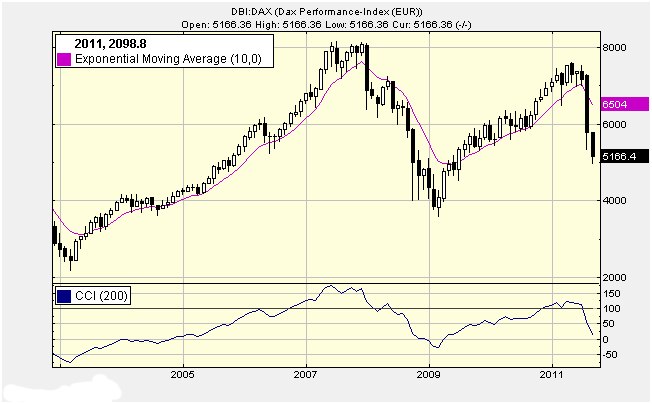
Note by experienced technical trader Henry Atkins: Don’t you think candle engulfing patterns (& most other indicators) work better on longer time frames. The problem with the engulfing pattern is that it will often give quite deep stop positions which requires quite deep pockets and a high conviction on the part of the trader especially when trading short. We all know that markets fall faster than they rise so the short reversal will mostly require a deeper stop than the long reversal. Consequently there will usually be far more risk in the short trade than the long trade. The DAX monthly chart shows this well with each trend reversal being quite obvious and reliable but the short side reversals carry far too much risk compared to the long side reversals which would both have made relatively low risk and highly profitable trades. It’s one of the reasons that I now prefer trading the long side.