
Sometimes called blowoffs and selling climaxes, these are dramatic market actions. The two terms are opposites. Blowoffs happen at market tops, and selling climaxes occur at bottoms. Take a look at the Light Sweet Oil chart again–
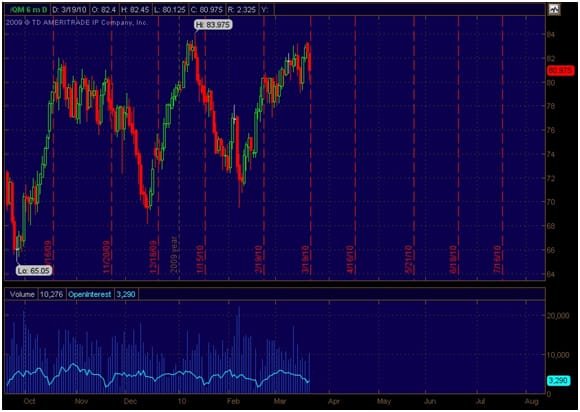
A blowoff occurs when the price shoots up with increased volume, but the open interest declines, and the price peaks and drops abruptly. You can see that the high of 83.975 occurred with an increase in volume but a declining open interest. The result was a sudden drop back.
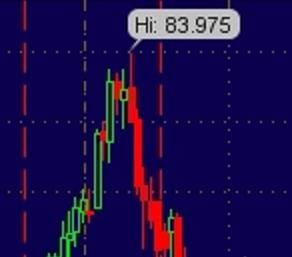
The definition of a top reversal or blowoff is when a new high is set in an uptrend, but the close is lower than the previous day. As you can see on the enlarged section above, the red candlestick fulfils this definition. The high of 83.975 was the peak achieved by the price during this period, but the red candle, bearish in this color scheme, shows a close way down at the level of the dotted line, which in this case represents 82.000.
Reversal days do not have to be in futures, you can see the same chart pattern in any security, but with other financial instruments you will not have the clue of declining open interest to warn you that it may be about to happen. You will however still see an increased trading volume.
This is a signal for a near-term trend reversal, and is stronger the larger the day’s trading range, and the greater the volume. In this case, the reversal was dramatic, as you can see.
The bottom reversal day, or selling climax, is just as dramatic. There is heavy volume as many of the long positions decide to sell out of the downtrend, and with the selling pressure off the prices quickly rally again. Prices may continue to rally or decline again later, but this low point is a significant factor.
Reversal days can be seen on weekly and monthly charts too, where analysts regard them as much more significant. For instance, on a weekly upside reversal, the market would trade lower during the week and make a new low for the price move, but by Friday the price at the higher than the previous Friday’s close. On a monthly chart a top reversal pattern would be when the market has been trading higher this month than last, making a new high, but the month closes with the price below last month’s close. It is obvious that these booths are much more significant, because they are sustained over the period of a week or a month rather than single daily occurrences.
Just to recap, the reversal day (or week or month) does not necessarily signal the top or bottom of the market, but often will. It does however always signal a significant high or low in the market.