Starting out in financial markets can leave a lot to learn, but moving averages are one of the first methods of assessment new traders pick up, because of the relative simplicity of the system.
Introduction
The moving average is one of the most widely used indicators in the realm of technical analysis. As you will learn from studying this module, it is also one of the most versatile, and many traders do not appreciate the many different ways in which they can apply it to maximize their profits. However, because it’s so easy to understand and construct, it does form the basis of many trading systems.
Moving Averages
When it comes to trading, being able to identify a trend is a major asset. Once you can work out whether the market is slowly going up or down, albeit in a rather bumpy fashion, you can start to calculate where you expect it to move next. Whilst it may seem obvious, spotting an overall trend can be incredibly difficult when it is being disguised by many smaller peaks and troughs along the way.
The first thing to note is that the moving average is unambiguous, whichever type you choose, so you can rigorously back test any system that uses it. This is in contrast to pattern recognition, where different experts may vary on their opinion of what constitutes a triangle or wedge, or whether the volume is sufficient to confirm the validity of the pattern. So creating mechanical systems using moving averages is fairly easy, and you can concentrate on refining the details for maximum profit.
‘The’ moving average is actually a whole host or family of figures and lines. There are different types of moving average, and each type can be constructed as a whole set with different periods. Some types of moving average are better in certain tasks than others, and you are free to experiment and find the type and values which work best for your trading. I’ll give you the generally accepted values here, so you can start with them, but if you want feel free to ‘tweak’ them to see if you can get better results.
Following the Trend
Moving averages are a good way to highlight a given trend as well as identify when a change in direction occurs. They perform particularly well in a market that is trending strongly but not so well when trade is moving sideways. That’s why it’s essential to have other tools to rely on when moving averages aren’t making much sense or are failing to point in any particular direction.
In a nutshell, the moving average is simply the average price of a stock or market over a specified period of time. Its calculation is simple; add the closing prices for the period in question and divide by the number of trading days. For example, the five-day moving average would tot up the closing prices for the previous five days and then divide by five.
This is known as the simple moving average (SMA) as every day within the period carries the same amount of weight. There are other versions of the moving average that give weight to some of the data. However, most investors will learn everything they need to know from the SMA.
Simple Moving Average
I think everyone knows what an average is – it’s a set of numbers, all added together and then divided by the number of numbers. So the average of the numbers 1, 2, 4, 6, and 7 would be 4 – that is the sum of the numbers, which is 20, divided by the number of numbers, which is five. You can do this for any set of numbers, and it’s called the arithmetical or simple average of those numbers.
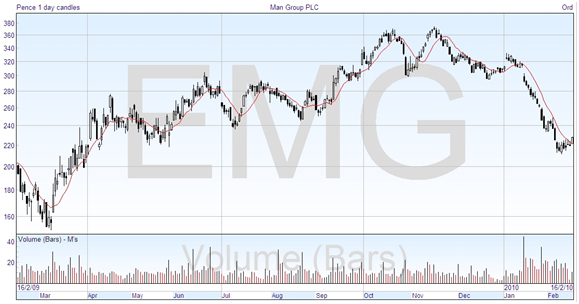
In trading, the basic type of simple average used is called the simple moving average because the value changes or moves every day and we draw a line connecting the values. The value on any particular day is the sum of the prices on the previous x days divided by x. So in the families of moving averages you already have the choice of any x. Here’s a sample chart where x is 10, so the simple moving average is referred to as SMA(10), and is the red line shadowing the prices.
By the way, I’m using the daily charts here as that is most common, but of course you can use moving averages on intraday charts, weekly charts, whatever you want.
Now because the average is based on prices that go back so many days, it is called a lagging indicator. Its value must always follow any market action, and can’t anticipate it. The 10 day moving average hugs the price fairly closely, and a longer-term average would give a smoother line, at times further away. In effect, the moving average smooths out the price information, so one basic use of it is to confirm the direction of the trend, up or down.
You can see in the chart that the moving average turns down a few days after the price turns down, and similarly lags when the price turns up — as you would expect. You might notice something else, too – the moving average is acting almost like a trendline, except that it is curving to follow the price. This is one way it can be used, as I’ll explain later.
Now to try and make the average line more relevant to the current price, traders have put together other ways of calculating the ‘average’. These are not so much averages as data manipulation based on a set of prices, but that’s what they’re called. The next most commonly used average is the exponential moving average (EMA), explained in the next section, and you can also find the triangular moving average, which applies more significance or weight to prices in the middle of the time period; the variable moving average, which changes the price weighting based on price volatility; and the weighted moving average, which applies more weight to the nearer prices. These and others have all been devised to overcome perceived limitations, particularly to try and reduce the lag effect.
Short, Medium or Long – the Choice is Yours
It is possible to change the timeline depending on how you are trying to trade; longer term traders would be more interested in the general movement whilst scalpers are concerned with the minute-by-minute adjustments. Traders considering fairly short term positions would usually use a 5-13 day moving average. Those with a medium term plan look at 50-100 day moving averages and those in it for the long haul usually stick with moving averages of more than 100 days, most often the 200-day chart.
Many traders use a combination of short and longer term moving averages to help identify trends and direction. This is because a moving average is exactly what it says – a moving piece of data. As the next period expires, it is added to the chart and the oldest piece of data drops off.
This helps to provide a smoothing effect to the result and minimise the distracting day-to-day minor fluctuations that can mask the true trend or movement. This effect is most pronounced in longer term moving averages than those in the short term.
Moving averages are a tool that even seasoned investors opt to include because despite their simplicity, they are a good way of tracking where the market has been. It also shows its overall direction and by comparing the current closing price to the average, it is possible to get an idea of where things may be heading. Most charting software packages will include moving averages as standard. The main limitation is that they are lagging indicators and thereby require careful handling if you are actually going to make any money out of them.