
The Stochastic Oscillator was invented by Dr. George Lane, and for a period in the 1990s it became a Holy Grail for traders. It goes into more depth on the price action than many other oscillators, which may explain its effectiveness. The initial idea on which it’s built is that in an uptrend the closing prices tend to be towards the top of the daily price range, and in a downtrend you’ll find the closing prices are lower down the range of prices each day. The oscillator measures on a percentage basis where the closing price is in relation to the price range for a given period.
Lane was actually testing a number of different ideas when he found this oscillator, and he used letters of the alphabet for each different concept that he tried. This is why you will see %K as the indicator — he just happened to be that far along the alphabet when he experimented with this thought which turned out to be successful.
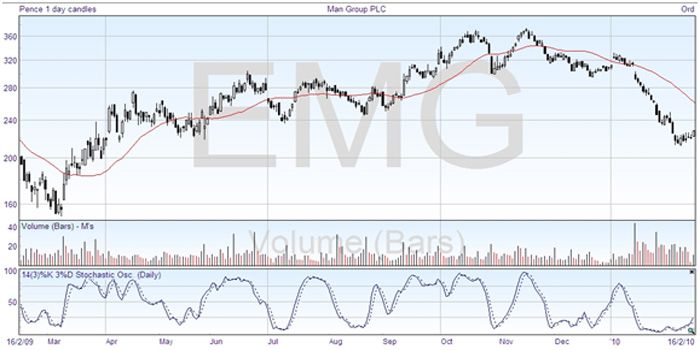
The first thing you’ll notice is that the stochastic oscillator has two lines. %K, the solid line, is the actual oscillator line, and the second dotted line, called %D, is a three period moving average of %K, and is used as a signal line. This indicator is actually called the Fast Stochastic. Many traders choose to use what is called the Slow Stochastic, which smoothes out the variations, and is created by first calculating a Fast Stochastic, then taking the Fast %D and calling it the Slow %K. The Slow %D is just another moving average of the Slow %K.
The chart shows a Slow Stochastic Oscillator based on 14 periods (days). This charting software, from ShareScope, allows you to play with the initial smoothing – the (3)%K represents three periods, making it the Slow Stochastic; and the 3%D means that the %D is another three period moving average. You can even change the type of averaging used for %D to exponential, weighted, or any of the other types we discussed in Module 6, giving you ultimate flexibility, or a bewildering array of choices, depending on your point of view.
Having settled on the variables, the first thing to watch for is a divergence of the %D line from the price line when it is in an over extended area — on this chart above 75% or below 25%, although some traders prefer to use 80% and 20%. When you see that, you wait for the signal of the faster %K line crossing the %D line to buy or sell. You see that October had several crossings above 75%, which might caused some false trading, but generally when the indicator lines went above 75% the crossing signal came clearly after the %K line had turned and was close to identifying the peak price. The same principle applies when looking for a long trade with the indicator below 25% — most trends were captured close to the lowest point, but with some multiple crossing in December.
In summary, the usual use is to wait for the %D to be in over extended territory and to diverge from the price action. Then the trading signal is when %K crosses it. Some traders like to use the stochastic oscillator with the relative strength indicator, as the RSI is less volatile and if you wait for both oscillators to indicate an extreme condition, you are less likely to trade signals that don’t work out. I’ve added the RSI to this chart –
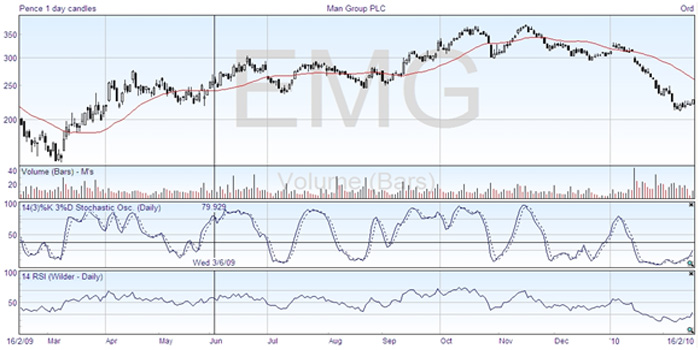
and you can see that you wouldn’t have been trading in that confused December area, where the price action is meandering, as the RSI never shows oversold.