
It is generally recognized that technical analysis started with the work of Charles H. Dow. This is the same Dow who teamed with Edward Jones, and is still remembered in the name of one of the leading stock market indices, the Dow Jones Industrial Average (DJIA).
Dow and Jones founded their business, Dow Jones & Co., in 1882. They started by distributing a small handwritten newsletter to banks and brokerages. It was called the Customer’s Afternoon Letter. It became the Wall Street Journal in 1889, and Dow continued as its editor. Dow was fascinated by the markets, and wrote many articles about them. He chose to measure the health of the economy by putting together an average of stock values in 1884. This average included nine railroad shares in a selection of 11 stocks. To Dow, the stock market was a barometer that would indicate the state of business.
In 1896, Dow decided to split transportation stocks and industrial stocks, and so the DJIA and the Dow Jones Transportation Average (DJTA) were created. The DJIA originally included 12 stocks and the DJTA had 20. In those days, transportation meant the railroads. Dow showed remarkable insight in recognizing the importance of following individual sectors.
Dow was a student of the interaction between the industrials and the transportation companies, and one of his basic doctrines was ‘What one makes, the other takes’. In other words, if industry is doing well and increasing production, then transportation shares should also rise as the railroads would be moving more goods to the consumer. This idea is included in the six basic tenets that are now known as the Dow Theory.
Other factors that Dow pointed out about the performance of stocks and shares were that share prices tend to move in trends for much of the time, that there were sometimes secondary trends countering the main direction, and that trends tended to continue until a major force acted to stop them. You may recognize that the secondary trends are the same thing as what we called retracements earlier.
Dow identified three types of trend, and these correspond to the three types I introduced in the technical analysis section. Dow defined them as follows: —
- An uptrend is when each successive high point is higher than the previous high, and the low points on the price chart also rise progressively.
- A downtrend is the opposite situation. Each successive low point is lower than the previous one, and retracements rise to progressively lower levels.
- The third trend is when both averages fluctuate within a range of about 4% of the same value. Commonly referred to as ‘trading sideways’, Dow called this a ‘line’.
Here are some sketches to illustrate the three trends -:
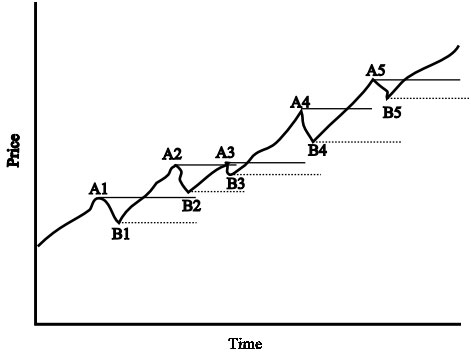
This is an uptrend. I’ve marked each high point, A1, A2, A3, A4, A5, and drawn horizontal lines out from them, so you can see that each is higher than the last. Similarly, I’ve marked the low points B1 to B5, with dotted horizontal lines which show that the low points get higher too. This is the way Dow defined it. It’s easy to see why you have to do this – if one of the high points or one of the low points was lower than the previous, then this might show that the trend had finished, and be the start of the prices falling. If the price behaves strictly in accordance with Dow’s definition, then the trend is proved and continuing.
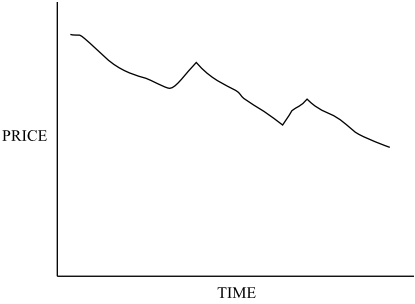
Here’s the opposite case, a downtrend. Again, the definition is strict, and as shown each successive high point (the C’s) and each successive low point (the D’s) is lower than the previous one. This is a downtrend, and there can be no doubt about that.
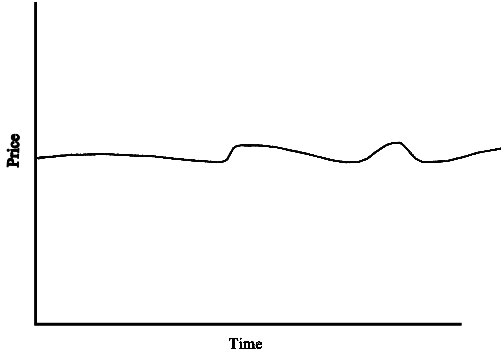
Here is the final trend, which Dow called the ‘line’, but is usually called trading sideways. Dow put a limit of 4% on the amount of fluctuation in the price. That’s because he was talking specifically about his charts of averages. When people talk about trading sideways, they don’t usually bother about the precise range of values in this way – after all, if you had a volatile stock the price would go up and down more than for a less volatile stock, and might exceed the 4% variation. You would probably still consider that the stock was trading sideways, with no real up or down trend that you can follow.
Dow never compiled his thoughts into a book. He died in 1902, but left behind a copious amount of work in the form of editorials published in the Wall Street Journal. Nelson assembled these beliefs into a book in 1903, where the term ‘Dow’s Theory’ was first coined. Dow’s successor at the Wall Street Journal, William Hamilton, developed the ideas further in a book published in 1922, and other notable authors have elaborated on his ideas over the years. Interestingly, Dow never saw his observations as a way to trade the stock market – after all he was commenting on the market averages rather than individual stocks – but offered them as a measure of general economic prosperity.