
Breaking the Line
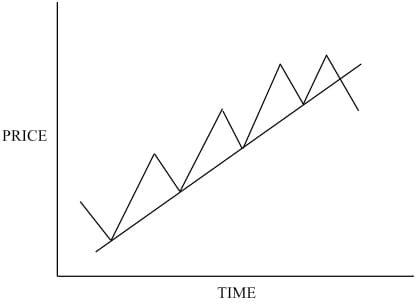
Nothing lasts for ever, so if you have a valid trendline and the price violates it, breaking through, this can provide the first sign that the trend is changing. Here’s an uptrend where the trendline has been broken –

This is a case where you might consider closing any long positions in the shares. Even with no other indications, this price needs watching.
There is no easy answer to how significant a minor break in the line may prove to be. Sometimes a price will break through the line during the day, but will close in keeping with the original trend. You could deal with this by redrawing the trendline to include the intraday penetration, but if the trend line is well-established it may be best left alone. Just watch for the later action to see whether the trendline remains validated.
Trend Breakdown: Breaking the Line
On the other hand, if the price closes outside the trendline this is more significant, and can be the start of a change in the trend. Even then, it may be an isolated instance and the price might come back into conformity. Analysts often try and allow for this by permitting a minor infringement, such as 3%, as long as the price then comes back into line. A valid trendline is a valuable tool and you don’t want to be scrapping it for some little glitch in the prices. While you want to take action as soon as possible if circumstances are changing, a little leeway may save you taking action and regretting it later.
Instead of permitting a certain percentage outside the trendline, you can also have a time factor. For instance, if the price closes outside the trend line for two successive days you may regard this as significant and the trend broken. To close outside the line for just one day would not matter, regardless of how much it deviated.
Role Reversal
Just as with the support and resistance levels discussed earlier, the trendline can reverse its role once it has been violated. The trendline on an uptrend, once clearly broken, may become a resistance to the changing price, as shown here –
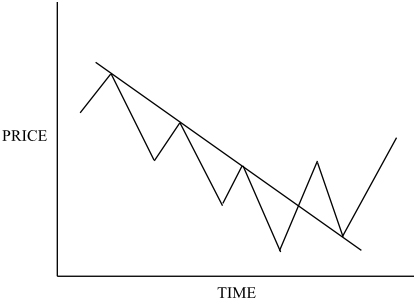
The same can apply with a downtrend, where the trendline becomes a support after it has been violated –
If you remember the previous chart I showed you, that had the up trendline becoming a resistance after the trend changed – here it is again for reference –
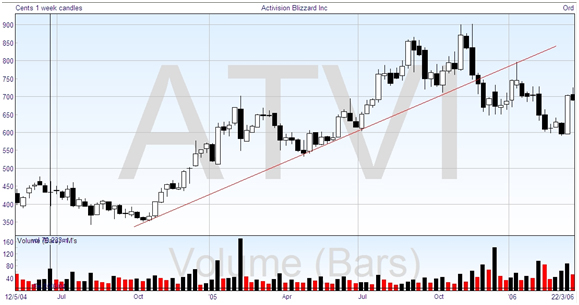
In January ’06 you can see the shadow rising to touch the line before the downward move continued.

Price Targets
There’ll be a lot more to say about price targets in the next modules, but for the moment I would note that, once a trendline has been broken, the price will often move as far to the other side of the line as it was above the line. The above chart shows an immediate drop to about 650, about 125 below the line, and recent highs in the uptrend hit about 900, which was 150 above the line – not that close in this case, but I’m sure you can see the general idea.