As an alternative, to try and overcome the disadvantages of a single moving average you might look at a system using two moving averages to generate trading signals. This is another commonly used system, and is called the double crossover method. It’s similar to the single moving average system, but instead of the moving average crossing the price, the signal is when the moving average crosses another moving average. Again, it’s best when the financial security is trending rather than moving sideways – moving averages cannot make much sense for trading when there is no trend.
First you plot two moving averages on the charts, with one of them a shorter time frame than the other. The signal to buy or sell is given whenever the averages cross. There are many different average pairs used – five day and 20 day, 12 day and 24 day, 10 day and 30 day, 10 day and 50 day, and so on. Since we already have a chart with a 10 day and 50 day moving average, we’ll look at that one.
The way it is usually stated, there is a buy signal when the shorter term moving average crosses above the longer-term average, and a sell signal when the short-term average falls below the long-term average. As a moving average is simply a smoothing of the price, the fundamental idea is the same as before.
Some traders will add a requirement for the long-term average to be moving in the direction of the trade, i.e. upwards if you are buying. I’ll just look at the chart for crossings, and see how we would have done trading long. Here are the crossings —
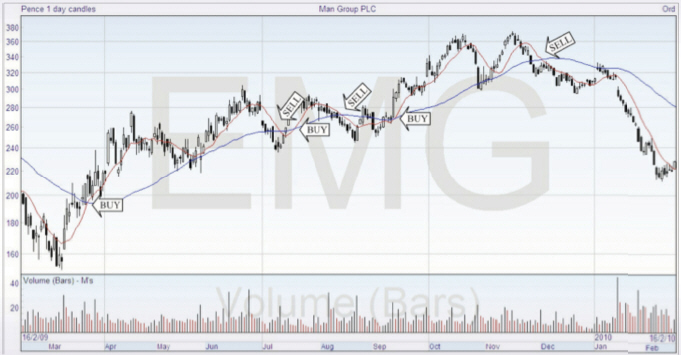
We would have bought at 200, selling at 240, where the stock was trading when we got the signal. We would buy again at just over 280, selling quickly for a loss at about 260. Our final trade on this chart would be buying at 290 and selling at 325. Our net gain would be 55, going long only. In this time the stock went from 160 to about 360, with in addition some tradeable retracements, so this method obviously left some of the possible profits on the table. But it did finish up with more gains than losses.
If you look at the chart again, you can see how using two moving averages compares with the single crossover system. It eliminates several possible whipsaws, and any outlying values have a much smaller effect. The two moving averages move smoothly towards and away from each other, and although there are a couple of points where the crossover is of very short duration, which would result in unnecessary trading, these could be eliminated by suitable choice of variables.
It is worthwhile then playing with the time periods used and back testing to try and optimize the signals. It’s generally recognized that the double crossover method lags the market a little bit more than using a single average, but usually produces fewer whipsaws.
Trend Strength
Trend strength can be indicated with moving averages according to the angle of the slope. A steeper slope means a stronger trend.
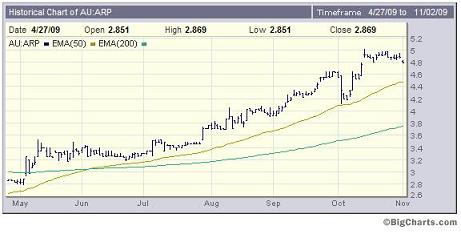
If you use two moving averages on the same chart, one slow and the other one fast, you can get an idea of the strength of the trend by observing how far apart the two moving averages spread as they rise.
Two very common MAs are the 50-day and 200-day. The 50-day (the faster MA) represents the intermediate-term trend and the 200-day (the slower MA) represents the long-term trend. If both MAs are rising and pulling apart then the trend is strong.
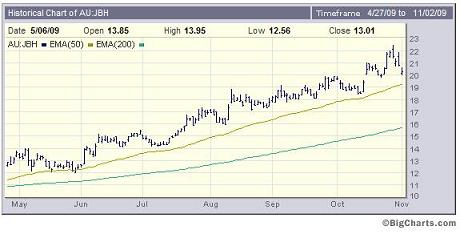
This stock is showing good trend strength with both the 50-day and 200-day EMAs rising strongly and spreading apart.
Moving averages can be used to generate buy and sell signals. Here are some common examples:
- buy when the price closes above a rising moving average.
- sell when the price closes beneath a moving average.
- buy after the “bullish crossover” of two moving averages. A bullish crossover occurs when a faster moving average crosses from below to above a slow moving average. This is a signal that a new trend might be developing. How long the new trend will last is an entirely different matter. A savvy trader might wait for confirmation that the trend is well established before jumping in.
- in a multiple moving average system where each timeframe (short-term, intermediate-term, and long-term) is represented by one or more MAs, enter a long position after all MAs compress together and then turn up.
You may hear traders talk about the “Golden Cross” and “Death Cross”. What they are talking about is simply the bullish crossover (in the case of the Golden Cross) and the bearish crossover (in the case of the Death Cross) of a shorter-term and a longer-term MA.
Often traders will use a 50-day MA (representing the intermediate-term trend – this is the shorter-term MA) and a 200-day MA (representing the long-term trend – this is the longer-term MA) when talking about a Golden Cross or Death Cross.
Market and Sector Analysis
A very simple and effective way to determine whether it’s a good time to put on a trade can be determined by placing two moving averages on an index chart representing the overall market (for example the S&P 500).
As a trader you need to regularly monitor the dominant trends of the:
- stocks in your portfolio
- overall market (via an index such as the S&P 500)
- markets sectors (via sector index charts)
The intermediate- and long-term trends are the most important. 50-day and 200-day MAs are adequate for determining the state of the market and its sectors.
Before buying a particular stock, part of your trading plan might insist on the overall market that you’re investing in be above rising 50-day and 200-day MAs. You may also want to see that the two MAs are spreading apart (indicating trend strength).
You can use 50-day and 200-day MAs to analyze the technical health of individual market sectors, in the same way that you do for the overall market.
Trading in the direction of the overall market increases your chances of a successful trade. Monitoring the dominant market trends is part of a trader’s due diligence.