Trading Reversals
One of the conventional strategies for traders is to watch out for a market making a top or bottom and then taking advantage as the trend reverses direction. This is known as contrarian trading although many times this is referred to as reversal trading and requires traders to spot the point when a trend is about to end and reverse direction, so as to profit as the market turns direction.
Reversals are hard to pinpoint but for those traders who get it right, it can be hugely rewarding. To start with, the entry levels to such trades are likely to offer very good value. In practice contrarion traders are seeking to ride starts of a trend which can provide for much bigger profits than entering an existing trend after much of the action has already taken place. A mistake that many novices make is to think that they must buy or sell at the point of reversal. In truth, no one can predict with any degree of certainty the actual point where the price reverses, and as long as you are alert enough to observe that a reversal has happened, and then place your trade, you will benefit from most of the move in a low risk way.
There are some clear advantages to a reversal trading strategy not found with other techniques.
There are some clear advantages to reversal trading not found with other strategies. It is often said that reversals can be harder to spot than larger trends, but reversals allow for better entry points (buying low and selling high).
By contrast pure trend traders are usually entering positions much later. Spotting reversals can be a complicated spread betting strategy but, with practice and the use of some technical indicators much larger profits can be gained.
There are many different types of reversal patterns. As such we have listed the most common trading reversal chart patterns for you to look at and use in your spread betting strategy.
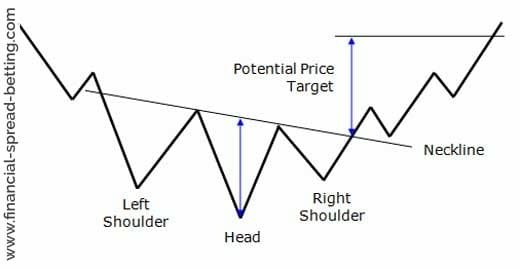
1. Head & Shoulders Reversal Pattern
The head and shoulder chart pattern is one of the most popular and arguably most reliable chart patterns. Head and shoulders is a reversal chart pattern that when fully formed, signals that the market is more likely to move against the previous trend. There are two versions of the head and shoulders chart pattern.
Head and shoulders top is a chart pattern that is formed at the high of an upward movement and signals that the upward trend is about to end.
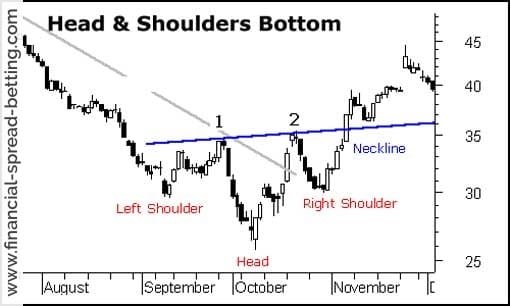
Head and shoulders bottom, is the lesser known of the two, but is used to signal a reversal in a downtrend.
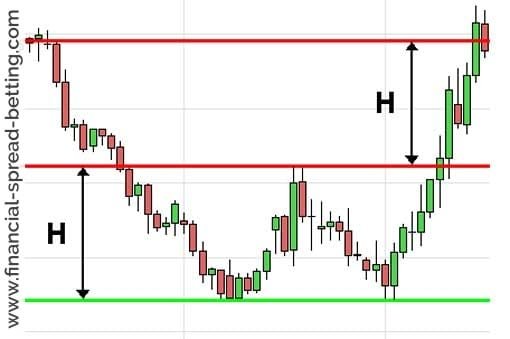
2. Double Tops and Bottoms
This chart pattern is another well-known pattern that again signals a trend reversal. It is one of the most reliable and most commonly used reversal patterns in spread betting. These patterns are formed after a sustained trend and signals that the trend is about to reverse.
formed after a sustained trend and signals that the trend is about to reverse.
The pattern is created when a price movement tests support or resistance levels twice and is unable to break through them. This pattern is often used to signal intermediate and long-term trend reversals.
In the case of the double top, the price movement has twice tried to move above a certain price level. After two unsuccessful attempts at pushing the price higher, the trend reverses and the price heads lower.
In the case of a double bottom, the price movement has tried to go lower twice, but has found support each time. After the second bounce off of the support, the security enters a new trend and heads upward.
Triple Tops & Bottoms
Triple tops and triple bottoms are another type of reversal chart pattern very similar to double tops and bottoms. These are not as common as head and shoulders and double tops and bottoms. These two chart patterns are formed when the price movement tests a level of support or resistance three times and is unable to break through; this signals a reversal of the prior trend.
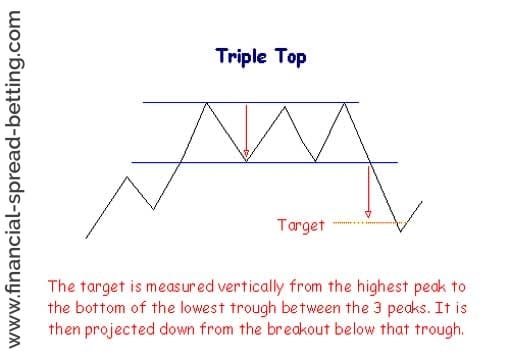
Identifying triple tops and bottoms can be difficult as during the formation of the pattern they can look similar to other chart patterns. For example, after the first two peaks are formed, the pattern will look like a double top or bottom, which could lead to entering into a trade too early.
Conclusion
There are many other types of chart pattern that will help support your trading strategy. As well as reversal patterns you can also have continuation patterns. These indicate that a trend will continue and not reverse. There are also other common chart patterns to consider when taking a more in depth look into technical analysis.
There are several ways that you can tell a reversal is likely, so that you can put the stock on a watch list. One way involves using technical indicators, which will signal if the stock is overbought or oversold and therefore prone to a price adjustment. Another way involves identifying significant levels of support or resistance, which are levels that have been tested in the past where the price has turned back. If they have been tested more than twice, then they are considered stronger. Thus, should a share price rise up to resistance and then starts to retrace it might be a good time to consider putting in a short.
In each case, you want to see that the price reverses back into the range it has been trading in before placing your trade. While stock prices can trade in a range for some time, eventually the pattern will break and the support or resistance line be breached, and you don’t want to be on the wrong side of that trade.
If you are trading a security that is range bound between support and resistance, your potential profit is limited to that range. But if you choose a leveraged instrument, such as spread betting, then you can still find substantial profit even within the range. As your money is multiplied by the spread bet, the amount that the price moves is less important for profitability, and you can afford to wait until the reversal is clear.
Not all reversals happen from established support and resistance lines. For instance, there may be an uptrend which ventures into new price levels where there is no resistance established, but the trend may run out of momentum and result in a reversal, or sometimes a consolidation. It’s normal for a trend to have some countertrend moves from time to time, as Elliott Wave Theory teaches us, and Fibonacci ratios can give us an indication of how far the retracement is likely to come before resuming the trend.
Finally, when thinking about reversals you shouldn’t overlook the classic indications of a pending reversal. With Western charting, one of the most well known patterns is the Head and Shoulders, so-called because the price makes a three hump pattern with the middle (head) higher before reversing into a downtrend. A reversal may also be signalled by a Double Top pattern. With candlestick charting, there are many reversal patterns that have been identified and catalogued. A most basic indication is the presence of a Doji candle, which is one where the real body has no length showing that the opening and closing prices were the same for the session. This usually indicates indecision and a possible reversal in a trend.