One Overbought/Oversold method, the trend channel, attempts to remedy the deficiencies of Stochastic by recognizing trends. Unlike Stochastic, where maximum and minimum are determined by the fixed high and low of the recent range, this method creates a channel, or envelope, which tracks the trend. The target is overbought as it approaches the upper limit of the channel and oversold as it dips toward the lower limit.
A moving average is used to smooth price activity and to approximate the trend. In the example below, a twenty-day moving average (MA) is used (shown in red). Two lines are drawn, one above and one below the MA, at equal distance from the moving average. These two lines envelope the price action of the target and establish a maximum and minimum for the purpose of calculating OBOS.
Overbought/Oversold Channel
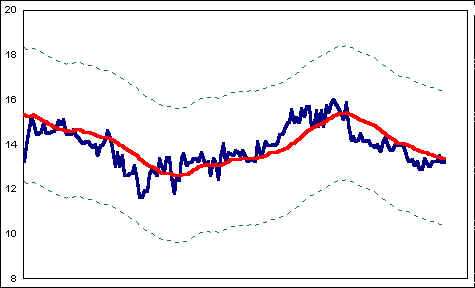
Unlike Stochastic, a trending stock will not become OB or OS as it reaches the limit of its recent trading range. Instead, rising stocks, for example, do not become overbought until the upper limit of the rising channel is approached.
It is the nature of strong stocks not to become overbought easily, but to become oversold on relatively minor corrections or consolidations. The inverse is true for weak stocks. The trend channel method, which takes the trend into account, captures that reality better than Stochastic.
Of course, one question remains: how far from the moving average should the channel lines be drawn? This is an important consideration since the location of these limits determines OBOS.
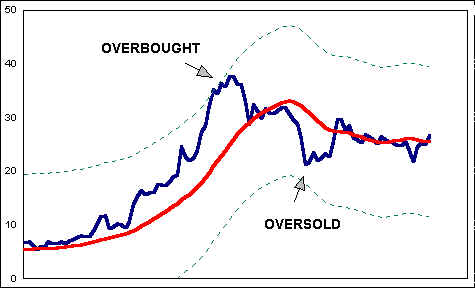
One ingenious solution uses volatility to place channel lines. The result is a channel which narrows and widens as volatility increases or decreases.
Volatility can be quite variable, and hence the OBOS range can fluctuate wildly. The effect is startling, but the practical utility of this device is questionable. Since the range is determined by averaging recent volatility, and since volatility can change rapidly, the range may narrow just as volatility jumps or widen just as volatility decreases. This produces trend channels which are out of synch with the action of the target.
Trend-Adjusted Stochastic
Trend channels are a promising approach, but the issue of channel width remains. The next OBOS indicator not only solves that problem but also combines the best elements of both Stochastic and the trend-channel method.
The idea is simple. As price fluctuates about a moving average, during some period, say 100 days, price trades at extremes above and below the moving average. These extremes vary from period to period and from issue to issue, depending on volatility and the trend.
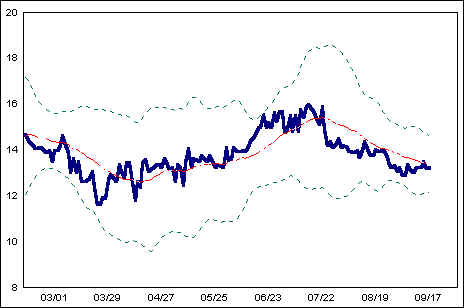
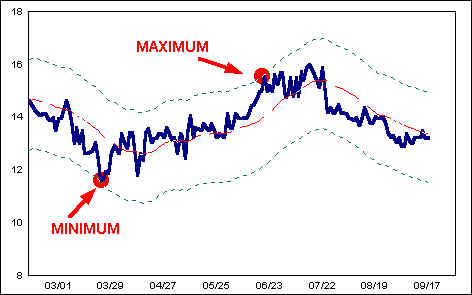
The Trend-Adjusted Stochastic sets the upper channel line at the maximum price fluctuation above the moving average. The lower channel line is set at the minimum price excursion below the moving average. In the chart below, maximum and minimum distances from the MA over the most recent 100-day period are shown.
Trend-Adjusted Stochastic
The calculation for Trend-Adjusted Stochastic is the same as that for Stochastic given in the last lesson, except that the maximum above the MA is used as the “high” of the recent range, and the minimum below the MA is used as the “low” of the range. Here’s how to calculate the Trend-Adjusted Stochastic:
1. For each of the last 100 days*, subtract the value of the 40-day MA from the price. If price is above the MA, the result will be positive; if below, negative.
Price-MA
2. Divide the result in step 1 by the MA.
(Price-MA)/MA
3. These calculations result in a series of 100 numbers, some positive and some negative. Now employ the formula for Stochastic offered in the previous lesson, using the last number in the series as Last (“last price”), the maximum of the series as the Maximum (“high” of the range) and the minimum of the series as the Minimum (“low” of the range):
(Last-Minimum)/(Maximum-Minimum)x100
*Note: The look-back period used to establish maximum and minimum for the series may be any length equal to or longer than the period used to calculate the MA.
Pulse
Trend-Adjusted Stochastic (TAG) and RSI are quite different methods for calculating OBOS. Combining the two brings together the merits of both. Pulse is calculated by averaging together RSI and TAG readings.
In practice, if the period used to calculate RSI is half that used for the MA of the TAG, the results will tend to support each other. For example, a 20-day RSI may be combined with a TAG using a 40-day MA to produce a short-term Pulse. An intermediate-term Pulse might use 40- and 80-day periods, and so on.
Pulse