
Note: In the next three lessons you will be shown, in detail, how to construct proprietary indicators for yourself. You may wish to set up your own spreadsheet to calculate these indicators. However, the calculations presented may be daunting for some. Those of you who find such calculations tedious should nevertheless read enough to understand the point and power of this analysis.
In the next three lessons, we discuss another approach to relative strength. This method looks separately at 1) relative performance in rising markets and 2) relative performance in falling markets, then combines these two analyses in a unique presentation.

A trader is like a coach. It’s the coach’s job to put his/her strongest assets on the field, whether the challenge is offensive or defensive.
Risk involves loss, or, more precisely, the probability of loss. Because the probability of loss is greatest when markets are falling, the defensive qualities of a stock are most severely tested during periods of market decline, just when the risk of loss is most acute.
To do well on defense, a stock must out-perform the benchmark during periods when the benchmark declines. In the graphic below, the benchmark separates strong defensive performance (to the left of the benchmark) and weak defensive performance (to the right). The benchmark is always equal to 100.
Defense

Rising markets are risky, too. If a stock cannot score as the market rises, it subjects the trader to another risk, lost opportunity. This risk is highest as the market rises. Therefore, offensive strength is best measured as the market advances.
To beat the benchmark offensively, a stock must out-perform the benchmark as the benchmark rises. A weak offense, on the other hand, under-performs the benchmark as the market rises. The benchmark separates strong offensive performance (above the benchmark) and weak offensive performance (below the benchmark). The benchmark is always equal to 100.
Offense

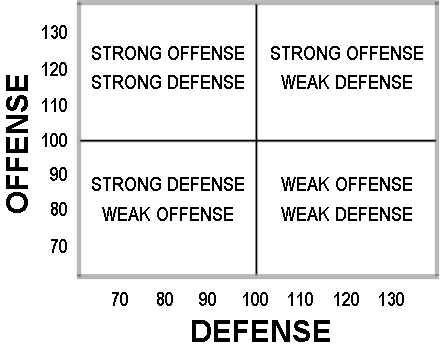
A two-dimensional matrix may be used to display the combined offensive and defensive qualities of a target.
Offense And Defense Combined
Computing Offense And Defense
Here’s how to locate a target within the Offensive/Defensive Matrix:
- Compute the daily percentage changes for the benchmark for 100 days* (column B in the spreadsheet displayed below);
- In separate columns (C and D), list changes greater than or equal to zero (Plus Days) and changes less than zero (Minus Days);
- Compute the daily percentage changes for the target over the same 100 days (column E);
- In separate colums (F and G), first list the target’s daily change for all days when the benchmark’s change is greater than or equal to zero (F), then list the target’s changes for all days when the benchmark’s change is less than zero;
- Compute separate totals of the benchmark’s Plus Days and Minus Days over the 100 day period, then compute separate totals of the target’s Plus Days and Minus Days over the same period.

6. To compute Offense, divide the sum of the target’s Plus Days by the sum of the benchmark’s Plus Days, then multiply the result by 100:
![]()
7. To compute Defense, divide the sum of the target’s Minus Days by the sum of the benchmark’s Minus Days, then multiply the result by 100:
![]()
*Any number of days may be used. 100 days is a good choice for intermediate-term indications.
In the spreadsheet example above, the results are:
Offense = .422/.484 x 100 = 87
Defense = -.297/-.235 x 100 = 126
The target has put up a weak offense over the last 100 days. An offensive score of 87 means that the target did only 87 percent as well as the benchmark as the benchmark rose, and places the target below the offensive benchmark.
The target is also weak defensively. A defensive score of 126 means that the target lost 126% of the total given up by the benchmark during those periods in which the benchmark declined. This places the target to the left of the defensive benchmark.
The position of the target is shown in the matrix below. A target in this position is weak in both rising and falling markets.
Weak Offense Plus Weak Defense
