The point & figure chart below gives us some sense of the near-term rally objective we may expect for GE. Because of the low price of GE, a one-half point chart is used.
The vertical drop from 15 1/2 to 10 (A) frames the horizontal trading range on the left. The last figure on the right reached by GE is 10 (B). Should the stock rally to 10 1/2, another figure would result at that level. That figure is shown in a lighter shade to indicate that the stock has not yet reached 10 1/2. However, we fill it in provisionally in order to compute the count along the 10 1/2 line.
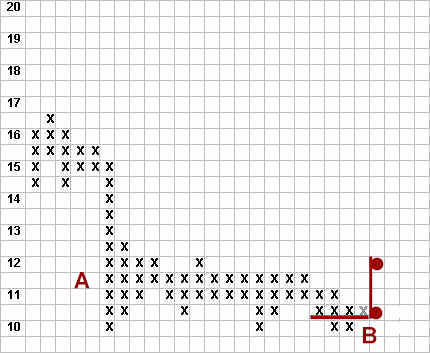
The most conservative count at 10 1/2, including the shaded “x”, is 4 x’s. A count of 4 suggests a rally of two points (4 x 1/2) to a target of 12.
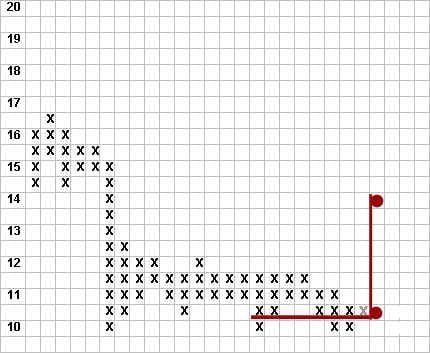
If we extend the count to the left, there is a longer line of 8 x’s at 10 1/2. This longer count suggests a higher target of 14 (see below). Until and unless this second target of 14 is reached, we will not consider targets beyond 14 suggested by counting to the vertical wall, left of the chart.
Point and figure charts can be very useful tools, but should not be relied on exclusively nor used mechanically. Price-volume charts are the best instruments for detecting the quality of supply and demand. P&F objectives should be considered suggestive and provisional. Target areas suggested by P&F charts are stop-look-and-listen points only, and should never be considered definitive.
We took a small, initial long position at I, then added to the position at J. Our expectation now is that the price will attack supply at 11 1/2. This is consistent with our first target of 12.
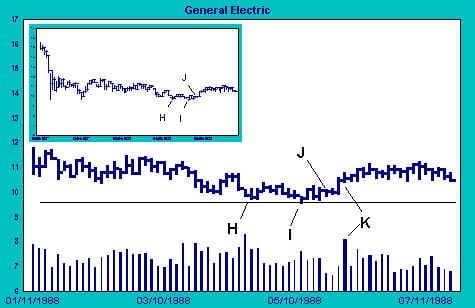
After a strong move up from support, GE runs into supply again above 11. Our evidence is the big increase in volume and spread compression at K. We would prefer to see the price move easily on only moderate volume at this point, and the action at K puts us on notice that supply may be alive and kicking.
Volume continues high as the price edges upward. Demand is working hard to push the stock up against the weight of supply at 11. Then the stock settles into a trading range. Buyers and sellers are contending for control, and the net result over the balance of the period shown above is stalemate. The failure of the stock to meet even the first modest objective of 12 is a concern, but our position at this point is small and our risk is well-defined. Overall indications remain positive.
Our plan is to hold our position. If another favorable buying opportunity presents itself, we will increase our long position. However, we are prepared to reduce or exit our position should we conclude, on the evidence, that sellers have gained the upper hand.