The next chart shows the normalized performance of Wal Mart (WMT) and the benchmark against which WMT is measured in this study, the Standard & Poors’ 500 index. Even without the aid of a relative strength calculation, it is easy to see that WMT outperformed the index over the period shown.
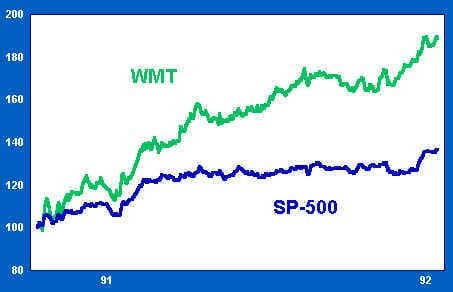
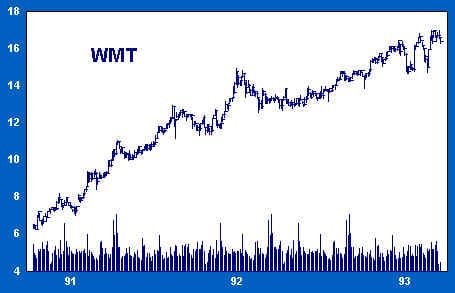
A distinction was drawn in the last lesson between the true and apparent speeds of a boat racing in a river’s current. That distinction carries over to the present case. WMT’s nominal, or “apparent”, performance is shown as a green line in the chart below. WMT’s true, or relative, performance is shown by the magenta line. The relative strength line shows the result of subtracting the SP-500’s nominal performance from WMT’s nominal performance.
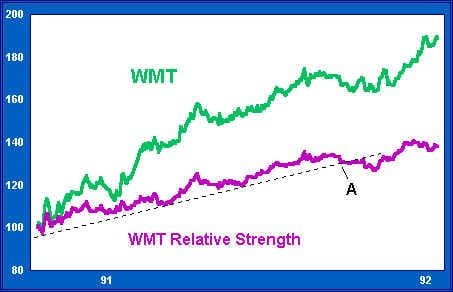
Relative strength tends to trend well, and violations of the relative strength trend often presage important changes in nominal behavior. Note the trendline drawn along several support points on WMT’s relative strength line in the above chart. Note, too, that support is broken at A. Thereafter the nominal price rallies, but a subtle shift toward weakness has nonetheless taken place.
Over the next year, other signs of underlying weakness appear. Relative performance tops out at B, while WMT’s nominal price continues up. This is the first telling divergence between WMT’s nominal and relative performance.
From point B, WMT’s price continues to advance, but relative performance dips. After handily outperforming the SP-500 from the lows of 1990 through the end of 1991, WMT managed only to stay even with the SP-500 after this point (B), as evidenced by its flat RS line.
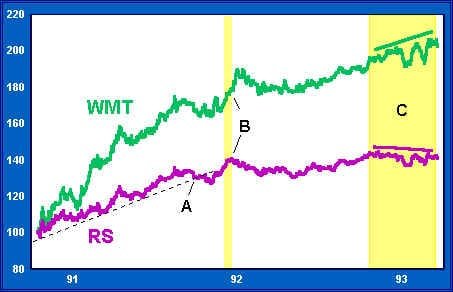
In the yellow area labeled “C”, the divergence between WMT’s nominal and relative performance is again clear. WMT’s nominal trend remains positive, but the relative trend betrays underlying weakness.
Except for increased volatility in early ’93, there is little in the stock’s volume behavior to suggest that WMT is under distribution. But by the beginning of 1993 at the latest, persistent signs of relative weakness alone are enough to make us wary of the long side. We remain neutral, with no position long or short.