
A one-half point chart of WMT provides two preliminary upside targets. The first count of 2 1/2 points (1/2 x 5=2 1/2) across the 11 row offers a target of 13 . This count makes sense to us since it returns WMT to the high point of the last rally.
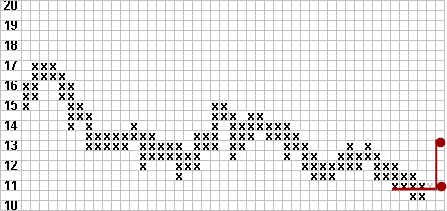
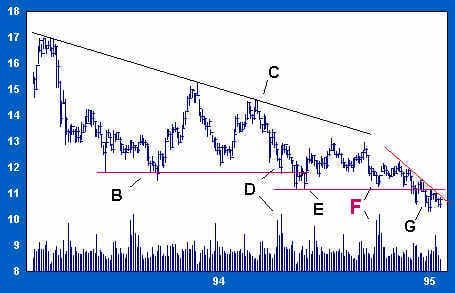
However, we may take another, somewhat more aggressive count across the 11 1/2 row. We begin our count, right to left, from the stock’s current position to the first point of support. The nearest high volume reversal is F (shown below), and it is the one from which we take our next count. This is one of several points at which strong hands emphatically assert control, and it is the point from which this latest phase of accumulation begins.
The count we take, from the initial support at F to the current point of support, encompasses two rows of x’s. While most counts occupy a single row, some do not. Remember, accumulation often feigns weakness, so price may slip considerably from the first point of support to the final reversal point in the accumulative process.
This second count offers a target of 14, as shown in the chart below. The base under WMT is becoming very large, and much higher targets are possible. But we will not consider them unless and until our initial, modest targets are reached.
The stock begins to rally out of the shakeout at G (see below). This is the evidence of strength we need, and we take a long position at the market as the price climbs above 11.
Our first target of 13 is reached at H. WMT then gives up half the gain on a reaction to I. This brings the price back to solid support above 11. The reaction appears normal, and volume indications are benign. After a two-day rally, the price falls back to J in a secondary test of support. Volume increases as the high-low spread compresses on this test, demonstrating support for WMT at this level. We add to our long position at the market.
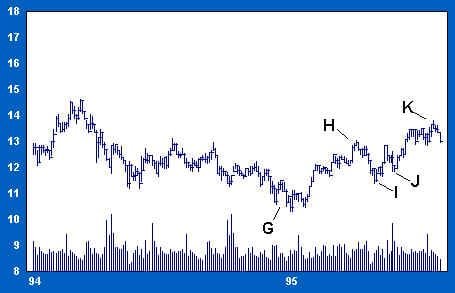
WMT clears supply at 13 and rallies to our second target of 14. Based on price-volume activity alone, we have little reason yet to abandon our long position.
However, WMT’s RS tells a different story. We note a divergence between the nominal and relative strength of WMT. While the stock’s nominal price broke its downtrend on the rally to K, relative price did not confirm this apparent sign of strength.
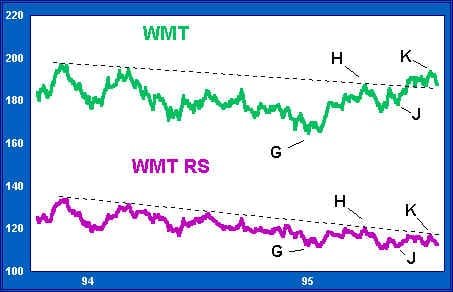
The rally from G to K has added roughly 1/3 to the nominal price of WMT. Ordinarily we would welcome this break-through rally as a prelude to much higher prices. But the inability of RS to confirm is a clear, bearish divergence.
This divergence puts us on guard. The new high at K may prove to be a trap. Traps, or shakeouts, attract the wrong sort of sponsorship and often lead to important counter moves. As a rule, a bull trap is confirmed once price falls back below the average close of the recent trading range. We are prepared to liquidate our long position should the breakout at K fail by falling back into the average of recent closes.
The stock has reached our second objective of 14, and based on WMT’s poor relative strength, we have serious doubts now about the stock’s near-term prospects. These doubts are confirmed as WMT dips back toward 13, and we close our long position at the market.