
A number of years ago, shortly after I had worked out the calculations covered in the last two lessons, I showed my business partner the results. He took one look and asked, “Why don’t you show the way the target moves over time?” Eureka! This was a simple yet brilliant idea, and I rushed back to the computer. Later, I showed Jack the chart. “It looks like a worm,” he said, and the name stuck.
In the lesson, “Offense and Defense”, you were introduced to the method for calculating the position of a target within the offensive-defensive matrix. To create a worm chart simply repeat that calculation sequentially over some period. When the results are plotted on the matrix, the target will trace out a line from the beginning of the period to the end.
In the matrix below, a target moves from an initially strong position in the northwest quadrant, across the BEL, to a relatively weak position in the southeast quadrant.
The Worm
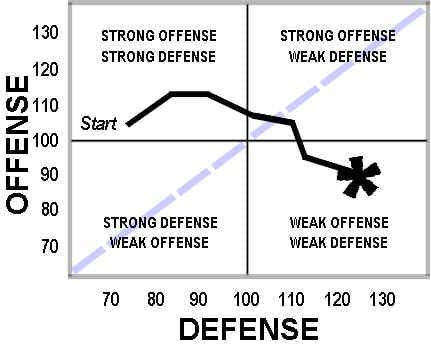
From the above chart we see not only the relative strength of the target, but the trend of relative strength against the backdrop of our matrix.
The next series of charts shows actual worm charts as of September, 1999. Each worm covers a period of twenty weeks from start to end. Data points are weekly.
The strongest sector during the late summer was Technology. Note that the worm gathers near the BEL before breaking through in a direct northwest direction. Such action is typical of targets which are emerging as strong leaders. The northwesterly trend of the worm indicates that both offensive and defensive strength are increasing at once, a very bullish sign.
Technology Sector

The worm chart of the Financial sector presents an entirely different picture. The worm is weak and meanders toward the southwest (weakness) over the period.
Financial Sector

The next chart shows an index made up of closed-end European country funds. The group has been basing for nearly one year.
Europe Group

The worm chart of the Europe group (below) shows that a recent history of relative weakness has placed the group southwest of the BEL. Nevertheless, the worm is trending very strongly toward the northwest. Note, too, that the worm is situated to the left of the defensive benchmark line. This is evidence that the group is now relatively resistant to decline and may be sold-out.
Europe Group

Superficially, the bar chart of the Internet group (below) is similar to that of the Europe group. Both groups show basing activity after a decline. In both, volume tends to dry up as basing proceeds, a generally positive development.
Internet Group

However, the worm of the Internet group shows a relative-strength trend quite different from that of the Europe group:
Internet Group

Beginning from a strong position NW of the BEL, the Internet group charted a direct course to the SE quadrant, giving up both offensive and defensive strength in equal measure. Until the worm turns, this group will not be a good candidate for purchase.
The next chart of the Retail Building Supply group shows a worm which tracks the BEL to the northeast.
Retail Building Supply Group

Quantitatively, relative strength of the Retail Building Supply group roughly approximates that of the benchmark, indicated by a worm which remains near the BEL. Qualitatively, this group is becoming more volatile, relative to the benchmark, as the worm tracks toward the NE.
The worm chart of Retail Office Supply (below) demonstrates another way in which the worm respects the presence of the BEL by its behavior. Note how the worm first moves north toward the BEL before veering away to the east just as the BEL is approached.
Retail Office Supply Group
