
The trendline is the most overused and least understood tool available to the trader. Anyone with a straight-edge and a pencil can draw straight lines on a chart, a process made even simpler by the introduction of computer charting programs. For that reason, trendlines should be used with care.
At worst, drawing trendlines is an exercise in geometry. There is a variety of “technical” analysis which relies heavily on trendlines, as well as on incidental shapes and formations traced out by price action, to arrive at buying or selling decisions. Since the intrepretive success of such methods is likely no better than random, this approach amounts to gambling.
An interesting test was recently conducted by a financial journalist. A number of technicians were presented with three price charts. Two of the price series were taken from traded issues and one was generated randomly. The technicians were asked to identify the randomly generated chart. Not surprisingly, their success was, on average, no better than one out of three, or random.
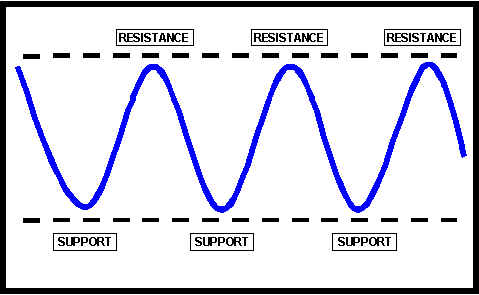
Drawing trendlines properly is a logical extension of identifying stationary price support and resistance points. Price zones which have previously halted and/or turned back rallies or declines indicate the location of entrenched buying and/or selling forces.
Stationary Support And Resistance
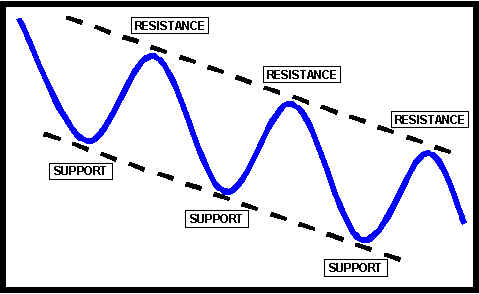
But if those forces are advancing or in retreat, like an army on the march they may be encountered later at some distance from their earlier position. Trendlines help track the rate of advance or retreat of support and resistance.
Advancing Resistance And Retreating Support
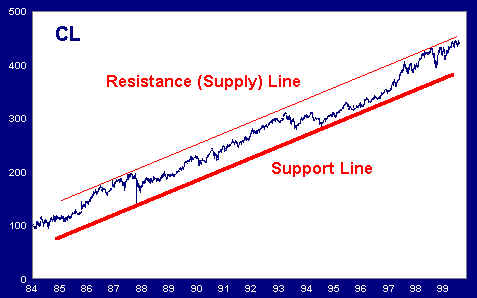
Supply And Support Trendlines
Trendlines may be drawn along both trending support as well as along trending supply (resistance). The result is a trend channel which brackets trading activity between two parallel, or roughly parallel, trendlines.
When a stock is advancing, a first trendline is drawn along ascending support points. A second trendline is drawn parallel to the first from one or more points of resistance to form a trend channel.
When an issue is declining, first draw a trendline along descending points of resistance before drawing one or more parallel trendlines from points of support.
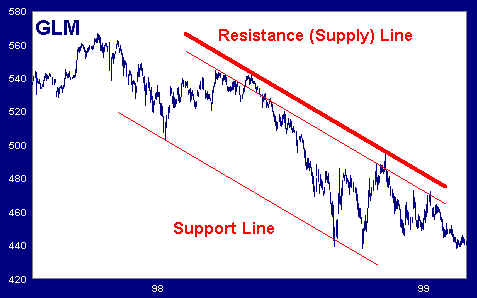
This normal process may be reversed. In that case, a trendline is first drawn along the resistance points of a rising trend, and then one or more lines are drawn parallel to the first from one or more points of support. For a declining trend, the support line is established first and then one or more parallel lines are drawn from points of resistance.
The key to successful use of trendlines is to keep it simple. Do not clutter your analysis with with myriad short-term trendlines. In general, the significance of a trend, and hence of a trendline, increases with the duration of the trend. For that reason, it is a good idea to confine your application of trendlines to intermediate- and longer-term trends.
Note: all of the examples in this discussion of trendlines employ log-scale charts. Because the same percentage change produces the same displacement on a log chart regardless of price, log-scale charts are generally better for trendline-drawing than arithmetically-scaled charts. This is particularly true if very long-term trendlines are drawn.