For a long time charting has been a dirty word.
For some sceptics basing investment decisions on little ticks on a graph, trend lines or anonymous kinks on a curve is about as trustworthy as consulting the ancient runes or using astrology.
In recent years, however, one has been able to say the word charting in polite company.
Sorry, I’ll just get this off my chest: ‘Charting, charting, charting. Thanks. ‘Flip, buttplug, charting.’ The tourettes is clearing up.
And just as people are starting to accept my ailment, they are also adopting the C-word.
Brokers, institutions and in particular hedge funds have come to rely on technical analysis.
So much so that is seems charting is now a hip word. Indeed, chartists have emerged from the closet and technical analysis has joined the mainstream.
Some of the jargon is impossible to decipher and does have the air of Russell Grant about it.
Instead of the moon rising in Uranus, you’ve have trend lines, resistance levels and golden crosses.
But it seems in the right hands, charts can an provide eerily good pointer towards whether you should be buying or selling stock.
So be free, be happy and enjoy charting.
In this section:
- Charting – the Basics
- Charting – about Trendlines
- Charting – about Moving Averages
- Charting – about Head and Shoulders
- Some Charting Terms
- Learn more about Charting
The Basics
It can sometimes take years to learn the intricacies of charting, so you might be better advised to buy an off-the-shelf system.
We have links to several reasonably priced, well constructed software packages.
And there are many books on the science such as an Investor’s Guide to Charting, Technical Analysis Plain and Simple and Technical Analysis for Dummies.
But before you shell out hard earned cash, take a look at the basics.
Nowadays, chart data is available to both retail and professional investors – a far more level playing field than applies to company research.
Technical analysis takes the emotion and gut instinct out of share buying.
It suggests that while history may not repeat itself exactly, patterns do emerge.
And by following these patterns we can to some extent extrapolate and predict the future.
Trendlines
Accepting that markets are not entirely random is one of the basic tenets of charting and identifying the trend is the first crucial step along the road to making your prediction.
Markets don’t, however, glide gently upwards in a perfectly linear direction.
An uptrend is characterized by successively higher highs, while the periodic pullbacks form successively higher lows.
The reverse is true of a downtrend.
Just to add a degree of monotony to the process, share prices and markets can spend long periods just marking time.
If we know where the market is headed we can construct a trendline.
In a rising market a line can be constructed underneath the successive lows formed by the pullbacks within the bull move. (see below).
In a bear market the trendline will be a downward sloping line connecting the tops of the bear market rallies. (below).

Moving Averages
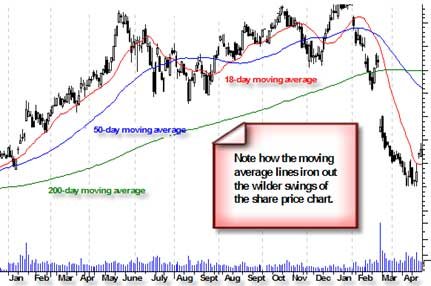
A further important tool of trend analysis is the moving average, one of the most widely used technical indicators.
A simple arithmetic mean of a previous run of closing prices is one of the most popular moving averages.
A moving average smoothes the trend, producing a line on the chart that lags behind the price data, but makes the trend more easily identifiable.
Weighted averages can also be used to give more relevance to the most recent price data.
As well as a visual guide to the prevailing trend, moving averages are used to generate buy and sell signals. In a bull market, when the current price drops below the chosen moving average, a sell signal is generated.
A shorter-term average follows the price data more closely, but will generate more false signals.
To smooth out some of the false signals, two moving averages can be used, such as the 10-day and the 50-day. In the bull market example, the sell signal is generated when the shorter-term average crosses below the longer-term one.
There are various ways to decipher their meaning, but one of the most reliable is the golden cross.
This occurs when a line on a graph charting the short-term (50-day) moving average of a share or index moves above its longer-term (200-day) average as they both move upwards.
The logic is compelling.
If moving averages are rising, so should an index or an individual share, at least for a while.
The same also applies in reverse with so-called dead crosses, or sell signals – hence the usefulness of charts for hedge funds.
How long a rise or fall will last is harder to predict.
Pullbacks to an upward sloping trendline in a bull market can be used as buying opportunities by those who have missed out on the initial move.
When a trendline is violated, it is an important early signal of a change in the direction of the trend.
If the market closes below a trendline – one that has supported the market on repeated occasions over several months of a bull market – it is a signal that the technical trader ignores at his peril.
Head and Shoulders
Another oft used term chart is the head and shoulders.
No – not the dandruff shampoo – but another graphic sell sign.
As you see below, the share price reaches a peak, falls and then rises above its former peak, only to fall back again.
The first and third peaks are the shoulders, while the second (and you have to really squint here) is the head. (see below).
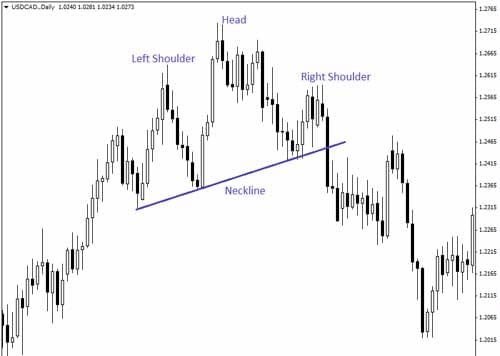
Essentially, when the price falls from right shoulder and breaks through the neckline, it is time to sell.
At this stage I can see you are lost.
Suffice-it-to-say, charts must be watched carefully and are better suited to short-term traders than long-term investors.
And not even their biggest fans would argue that charts alone provide all the investment answers.
They should always be used to complement other valuation methods.
Some Charting Terms
Impress friends and relatives by dropping some of these phrases into casual conversation.
Support level – price is unlikely to fall below this level.
Resistance level – price is unlikely to rise above this level.
Breakout – when a stock does eventually move above the resistance level.
Trend line – predicts future prices based on past pasrt prices.
Moving average – stock or index price averaged over several days head & shoulders – sell signal.