Now if you look at those three charts, for example, you will see why the Random Walk Theory is really disproved in practice, and why traders have no fear that their analytical basis is unsound. Quite often a daily chart will look...
Now if you look at those three charts, for example, you will see why the Random Walk Theory is really disproved in practice, and why traders have no fear that their analytical basis is unsound. Quite often a daily chart will look...
Although daily charts are the most widely used by traders, charts plotted on a longer timescale give a perspective on the markets and the particular shares you are interested in. When you are analyzing trends for your trading...

Open Interest You should remember from Module 1 that open interest is another type of trading volume. It is used for futures contracts, and is a count of all the outstanding futures contracts that are out there. It is simply...

When we discussed market action in the first module, price was only one of the factors. The second factor in most trading is the volume, and it is important for technical analysis that we have a way of examining that. If you...

When you plot your charts, you will have a choice of using arithmetic or logarithmic price scales. Don’t worry, as the computer does the work for you, you don’t have to remember your school lessons about logarithms...

Now you are familiar with how charts are drawn, here are examples of line, bar, and candlestick charts which are all drawn for the same stock and timeframe. You can use these to show you the information in different ways...

Before we look at real life charts, there is one other form which is very popular, and that is called the candlestick chart. There are quite a number of different chart types but the one most used by traders tends to be daily...

Perhaps the most commonly used chart for Western traders, and one which includes all four prices for each day, has been the daily bar chart. This is called a bar chart because each day is represented by a vertical bar which goes...

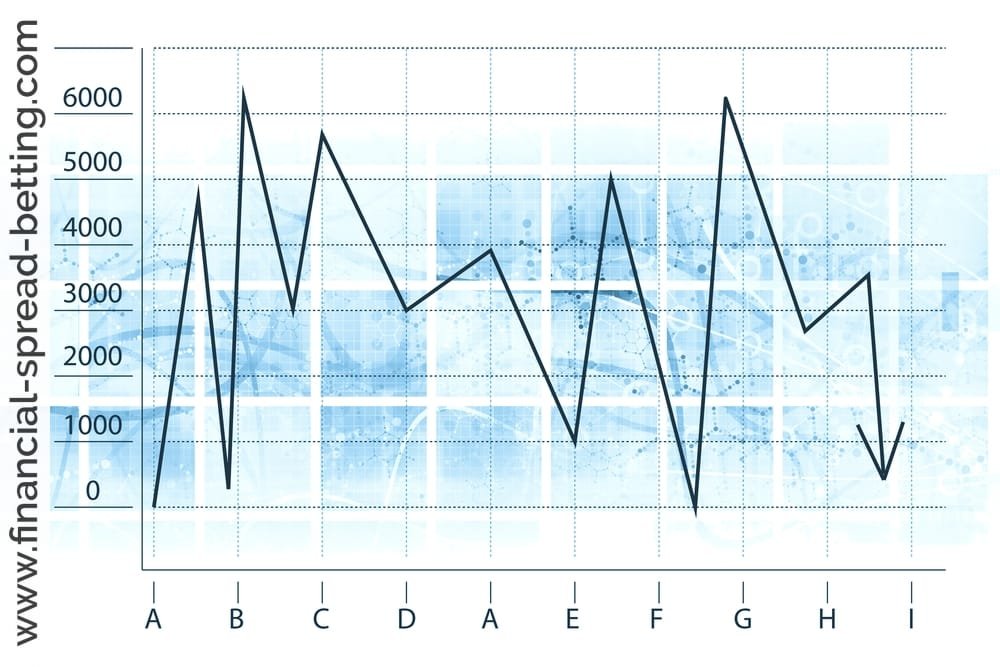
Line Charts The first charts you were introduced to, in Module 1, are called line charts because they represent the progress of a price over time by a single line which goes up and down. This line is based on the closing price of...
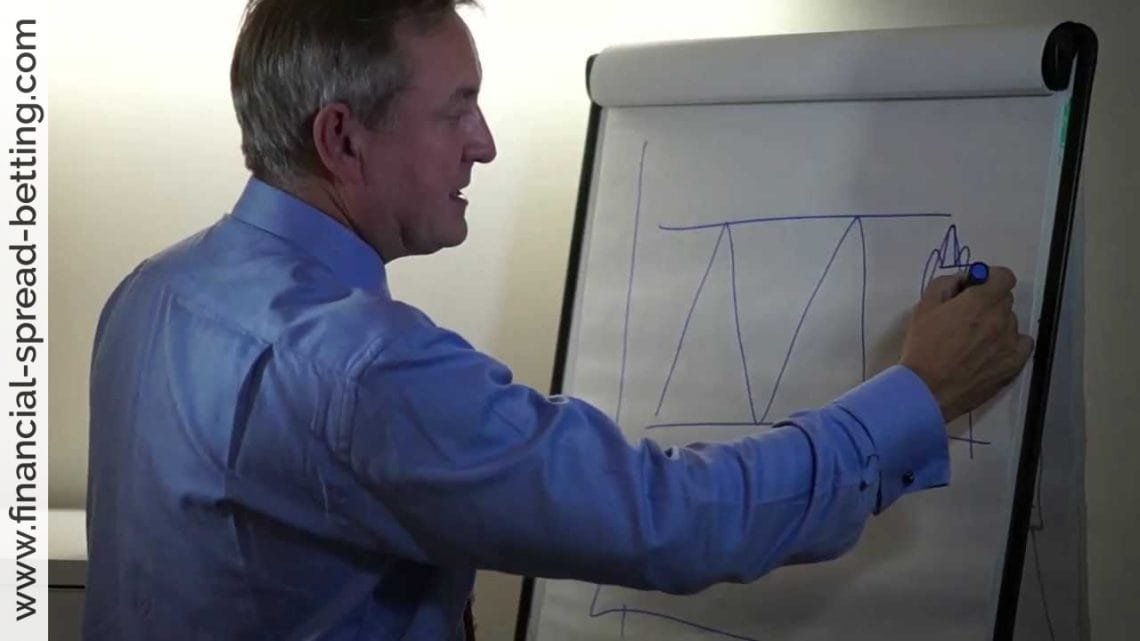
Module 2 – Charting Basics Charts are an invaluable tool for stock and spread betting traders. Indeed, I would say that any time that you as a trader spend studying price charts will be worthwhile. Chartists study the recurring...