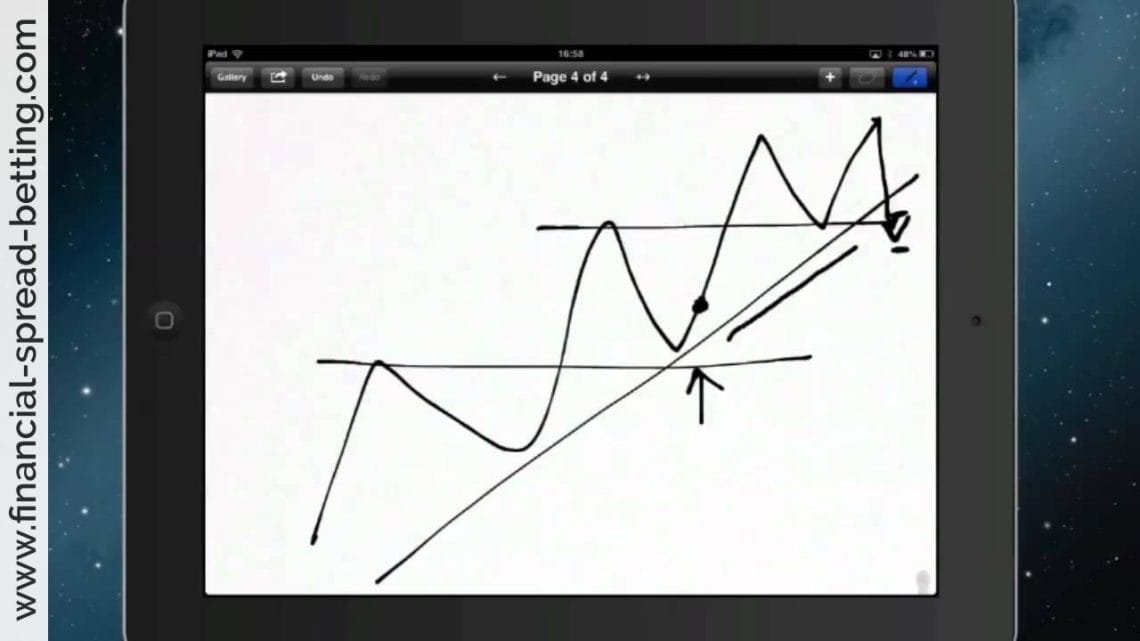
Now for reasons I’ll go on to explain in the next section, often support and resistance reverse their roles, once they are penetrated or ‘broken’. If the price goes up through resistance by a good way, then that...

Now for reasons I’ll go on to explain in the next section, often support and resistance reverse their roles, once they are penetrated or ‘broken’. If the price goes up through resistance by a good way, then that...

Another way of looking at peaks and troughs in a price chart is using the concept of support and resistance. Again, this is a fundamental idea used in technical analysis, and the various aspects of it can be very powerful...

Now you may remember that Dow Theory talks about the three parts of a trend, the primary, secondary, and minor. The primary or major trend may last for years, and Dow classified it as something lasting more than a year, although...

Module 3 – Trend Concepts Introduction Now that we have reviewed the fundamental ideas of technical analysis and the basics of charting, it is time to introduce you to some tools that you will use as you develop your knowledge...
Now it’s time to get an overall idea of how charts fit in to the world of technical analysis and the many ways that you can use them to help in your trading. They are an essential device for the trader to spot...

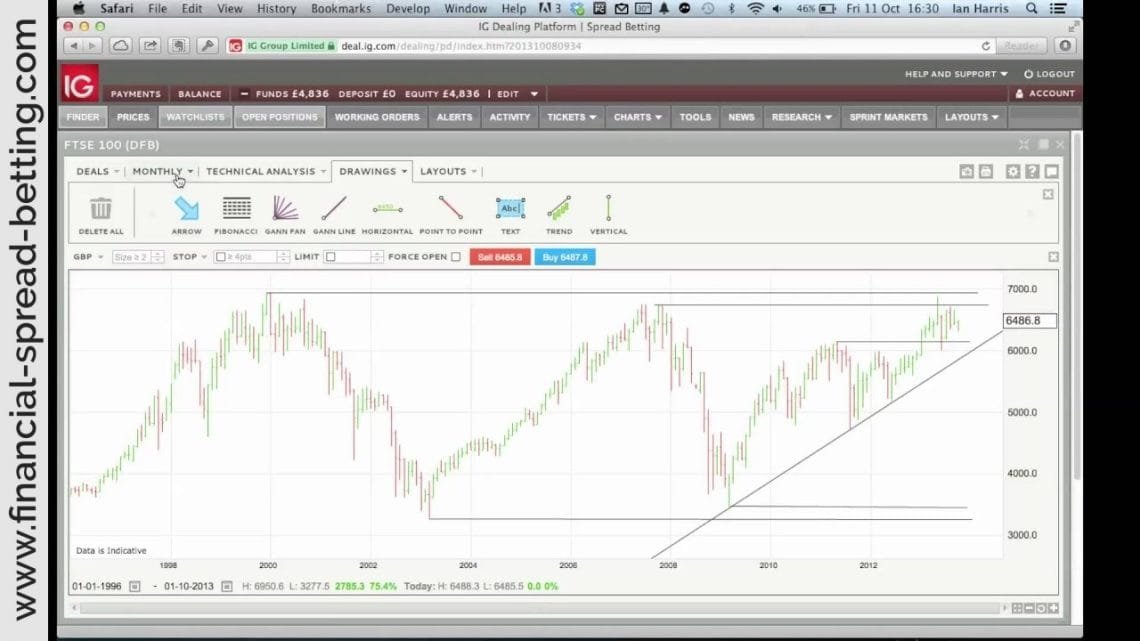
When you’re looking at using long-term charts in connection with your trading, you may wonder how you can apply this to the futures markets. Futures markets, and for that matter options too, have expiry dates associated...

Now with all this talk about long range charts, you may have been wondering whether inflation will upset your analysis, and whether you should try and account for it and make adjustments. After all, the rate of inflation must be...
Firstly, let’s be clear that you shouldn’t use long-term charts on their own for making any trading decisions. You can’t time your entries and exits from a trade with any precision based on long-term charts, and why...

Now if you look at those three charts, for example, you will see why the Random Walk Theory is really disproved in practice, and why traders have no fear that their analytical basis is unsound. Quite often a daily chart will look...
Although daily charts are the most widely used by traders, charts plotted on a longer timescale give a perspective on the markets and the particular shares you are interested in. When you are analyzing trends for your trading...