Futures Futures provide an exceptional opportunity for profit, which must be balanced against the risk involved. A futures contract is simply a binding contract to buy or sell something at a future date. The price is agreed and...
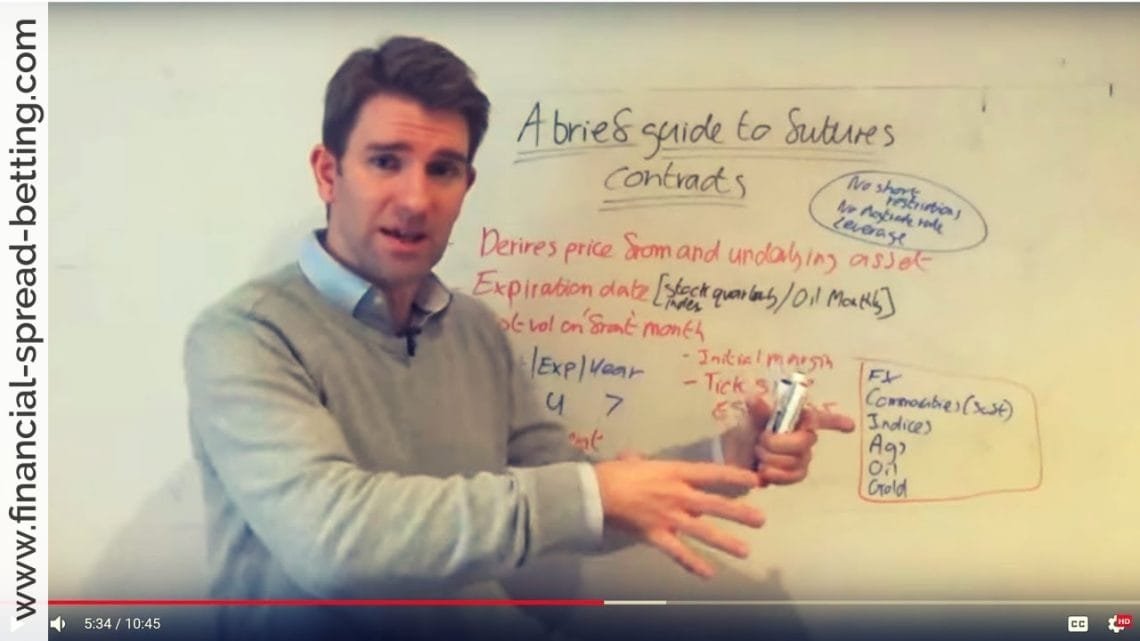
Futures Futures provide an exceptional opportunity for profit, which must be balanced against the risk involved. A futures contract is simply a binding contract to buy or sell something at a future date. The price is agreed and...
Stocks and shares are one commonly known type of ‘financial instrument’ which can be traded, but there are several others. Some traders are involved with the Forex market, that is buying and selling currencies, and...
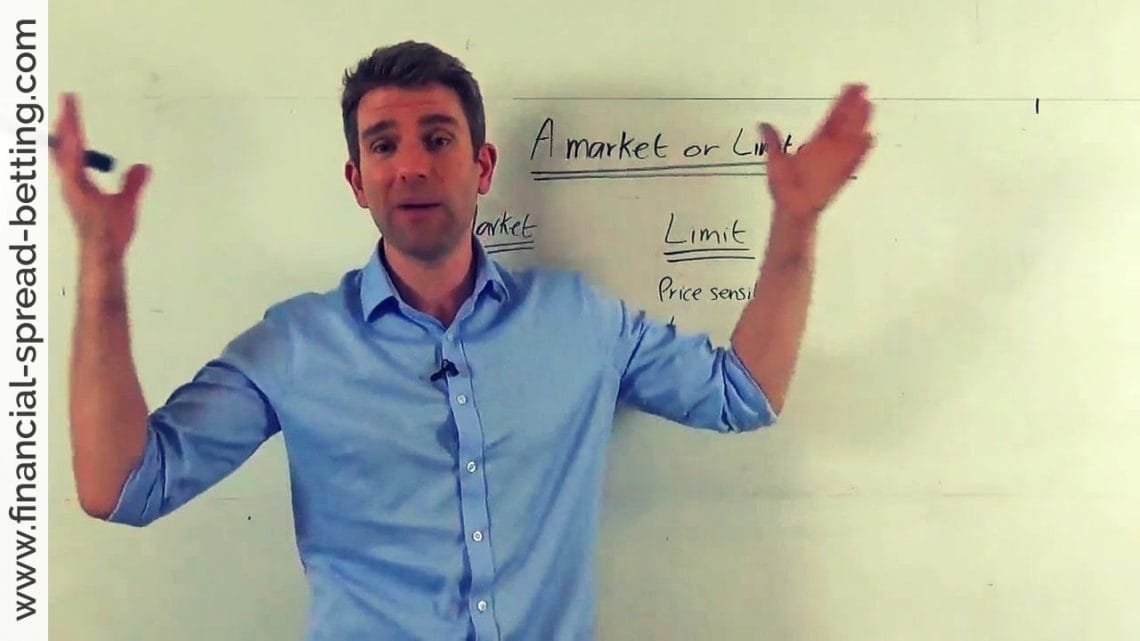
When you trade, you give your broker an ‘order’ to buy or sell the shares. You have choices on how you present that order, and that will influence how the broker fulfils it. This is covered in detail in one of the...
Understanding Long and Short Short Selling Selling something short is a topic that confuses some people. It is important to be comfortable doing it when you are trading, as otherwise you will miss out on a lot of potential profit...

The Financial Markets – What Are They? Markets have been operating probably since the dawn of time, since man is a trading animal! We are all familiar with a street market where, on special Market Days, several traders set up...
Forex Forex has become very popular in recent years, and it gives you a good amount of leverage for your money together with simplicity – most Forex trading is just around six different currency pairs. So you don’t get involved...
A CFD is an agreement between two parties to exchange the price difference of a financial instrument. The profit & loss is determined by the difference in the entry and exit price of the underlying instrument from when the...

Spread Betting The UK has a long tradition of betting, and winnings are tax-free. The US does not have the same regulations, which is why spread betting is not found in America. Financial spread betting came about in England in...

The Psychology of Trading Show Me the Money Many beginning traders think that they should concentrate on making money. Usually this doesn’t work. There is a money management module later in the course which will go into detail of...

The first kind of financial market was the stock market. As enterprises in the 17th Century became much larger than before, they could not be financed solely by the court, by the landed gentry or by the managers. There was a need...