
Comparing Averages
Another way of getting a feel for the market breadth is to compare the market averages. The most obvious example of this is Charles Dow looking at both the Dow Jones Industrial Average and the Dow Jones Transportation Average to see if they were in agreement and confirming the trend. Divergence between these averages, Dow asserted, meant that the apparent trend may not be sound.
It’s also possible to get a feel for the overall economy by comparing the averages or indices in the different markets. In the US, the DJIA is based on just 30 large cap stocks. You also have the S&P 500, looking at 500 companies, the Russell 2000 comprised of 2000 smaller stocks, the New York Stock Exchange Composite Index which is all stocks traded on the NYSE, and the NASDAQ Composite Index which has 5000 stocks. The NASDAQ composite is a weighted index, which means that the top 100 technology stocks usually dominate its movements.
All these indices and averages measure slightly different sectors of the economy, and comparing them can help you get a better picture of the overall health of the US market. For example, if you have a breakout in the DJIA, you should expect to see similar breakouts in the S&P 500 and the NYSE Composite Index, otherwise the breakout may not be all it seems. You can compare these indices in various ways, by dividing one by another to make a ratio, or simply plotting them together, as shown below for the S&P 500 and the NASDAQ.
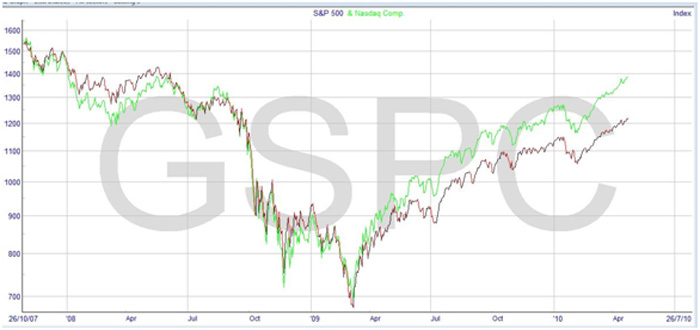
Note that there is pretty good agreement between the two indices profiles, which means that these markets are showing good strength. It’s usually a better indication for the market if NASDAQ, representing the technology sector, is slightly leading.
The study of market breadth can be used for many things. The overriding rule is that the greater the number of shares and averages that are trending in the same direction, the more likely it is that the trend will continue. This applies also to the other indicators we’ve looked at, such as advance-decline, new highs/new lows, etc.